Walkthroughs for interpreting and using BlockViz visualizations.

An interactive crypto technical analysis chart with candles and various indicators.

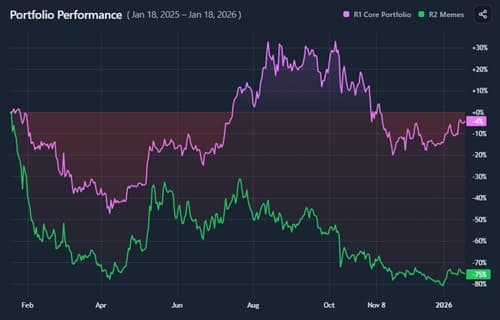
How to compare the normalized performance of up to three crypto assets over time.

See how a handful of days drive yearly crypto returns, and what happens if you miss them.

Spot seasonal patterns — averages by month/quarter, drill down by year.

Track an asset’s market share vs total crypto — or vs your own basket.

Compare market caps in absolute terms and as % share of a basket.

See market structure by coin or category — switch to delta to spot movers.

Estimate a token’s price if it had or moved toward another token’s market cap.

Compare lump-sum investing against periodic dollar-cost averaging.

What if you switched from one coin to another — did it beat holding?

Test a trim-and-rebuy plan vs simply holding a position.

Test fixed vs trailing stops and see when you’d get stopped out.