Interpretation
What problem this simulation solves
Crypto investors often ask a simple but slippery question:
“What if I had switched from one coin into another at the start?”
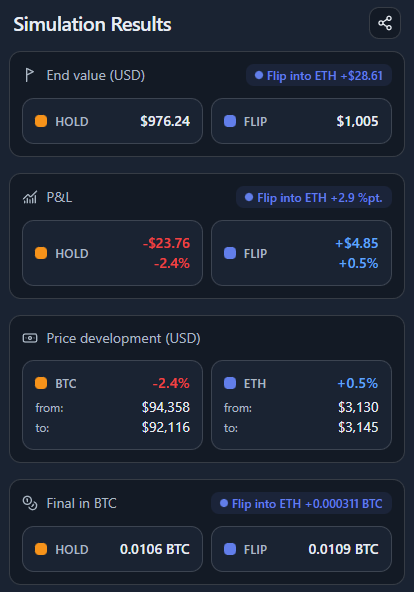
Price charts alone don’t answer this properly, because they ignore position size and denomination effects. A trade can look good in USD terms but still leave you with fewer units of your original asset.
Coin Flip makes this explicit by simulating a real position and comparing outcomes both in fiat and in crypto terms.
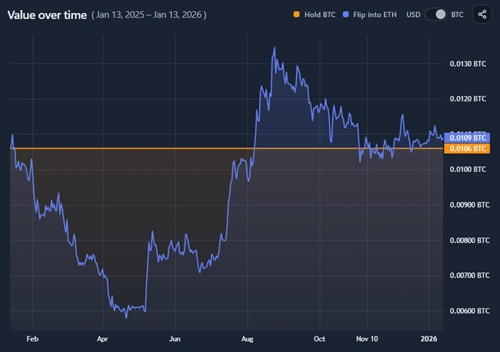
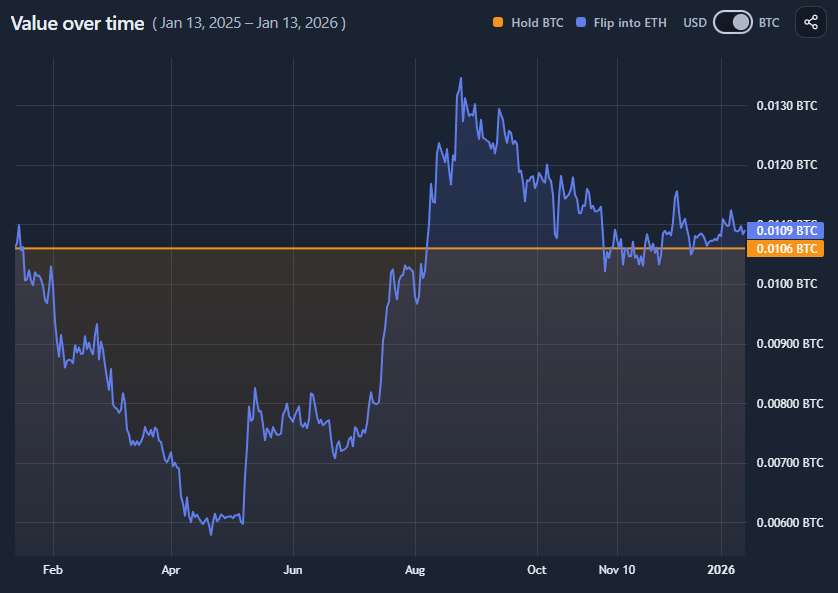
What you’re looking at

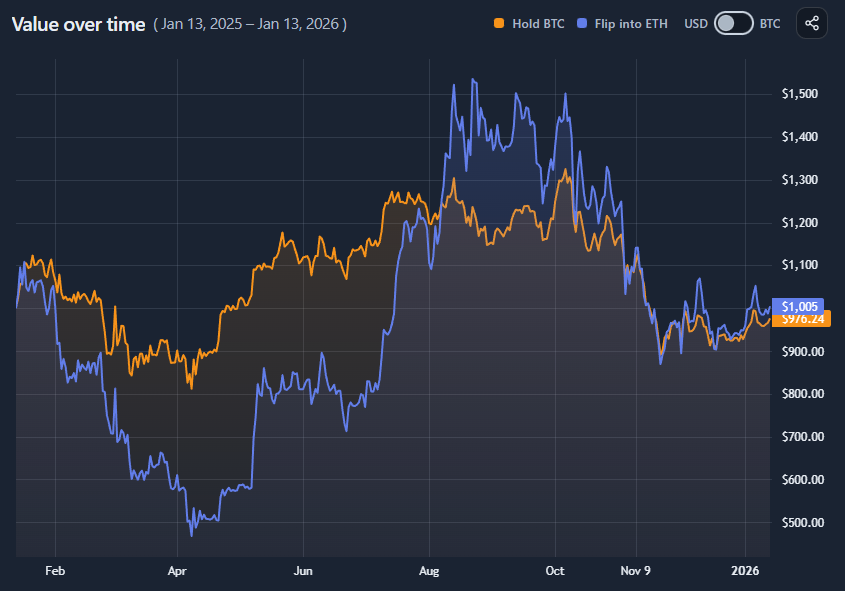
You are comparing two paths over the same time period:
- Hold
Keep the base asset (e.g. BTC) for the entire period. - Flip
Convert the base asset into a target asset (e.g. ETH) at the start, hold it, and convert the result back into the base asset at the end.
Both paths start with the same initial value and position size.
Value comparison vs unit comparison
Coin Flip intentionally shows results in two denominations:
- USD view
Shows portfolio value over time in fiat terms. - Base-coin view (e.g. BTC)
Shows how many units of the original asset you would have ended with.

This distinction is critical:
- A flip can outperform in USD but still result in fewer BTC
- Or underperform in USD while accumulating more BTC
Neither view is “more correct” — they answer different questions.
How to read the results panel

The results panel summarizes the comparison from multiple angles:
- End value (USD)
Final fiat value of Hold vs Flip. - P&L
Absolute and percentage profit or loss. - Price development
How each asset’s price moved over the period (from → to). - Final amount in base asset
How much of the original coin you end up with after the flip.
The highlighted winner simply tells you which path performed better on that specific metric.
What this does not imply
This simulation is not a strategy and not predictive.
- It assumes a perfect flip at the start and a perfect conversion back at the end.
- It ignores fees, slippage, taxes, and execution risk.
- It is fully retrospective.
Its purpose is understanding rotation sensitivity, not timing signals.
When this is most useful
- Evaluating past rotation decisions (“Should I have switched?”)
- Understanding opportunity cost between two assets
- Comparing performance in fiat vs “stacking” terms
- Stress-testing conviction in a base asset
How to use
Selecting assets and starting position

You can configure:
- A base asset (what you start with)
- A flip target (what you switch into)
- A starting amount, expressed in USD or base-coin units
- A date range
Both Hold and Flip always start with the same initial value.
Reading the value-over-time chart
The chart compares Hold vs Flip across time.
- In USD mode, it shows portfolio value in fiat
- In base-coin mode, it shows value expressed back in the original asset
A flat Hold line in base-coin view means:
- You kept the same number of units throughout
A rising or falling Flip line shows:
- How many base-coin units the rotation would eventually produce
Switching between USD and base-coin view

Use the currency toggle to change denomination.
- USD view answers:
“Did this flip make me more money?” - Base-coin view answers:
“Did this flip leave me with more of my original asset?”
Always check both — they often tell different stories.
Interpreting the final comparison
At the end of the period, compare:
- End value (USD)
- P&L
- Final amount in base asset
If results diverge strongly, it usually reflects relative volatility between the two assets rather than simple price direction.
