BlockViz
GuidesPortfolioPortfolio Development

Portfolio Development

Track a portfolio’s value over time and how each position’s share changes.

Open tool →

Interpretation

What problem this visualization solves

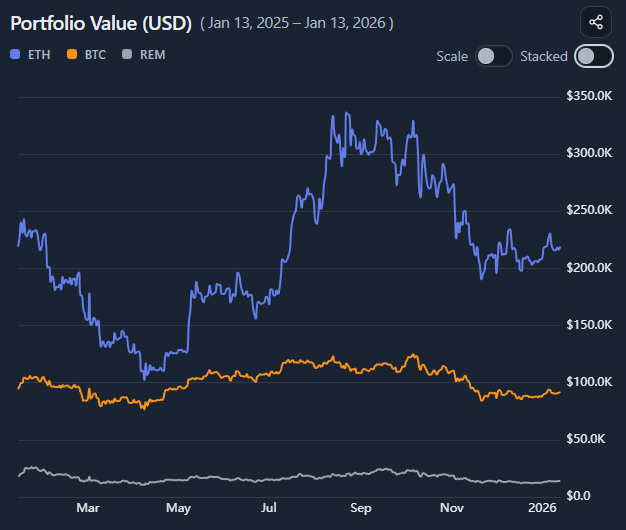
A portfolio’s total value alone does not explain how it got there.

This visualization helps answer:

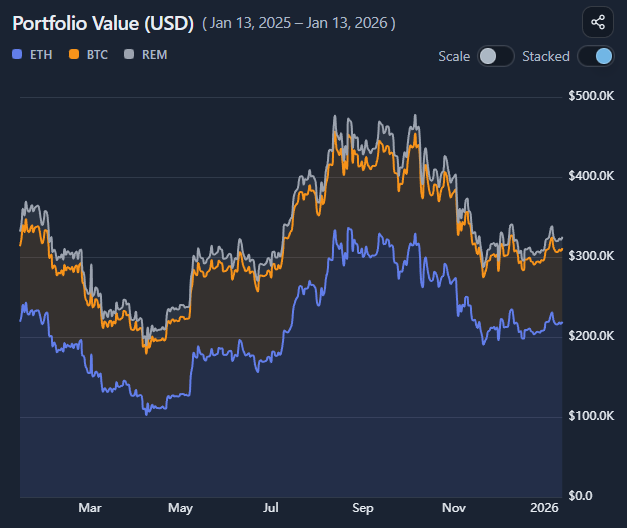
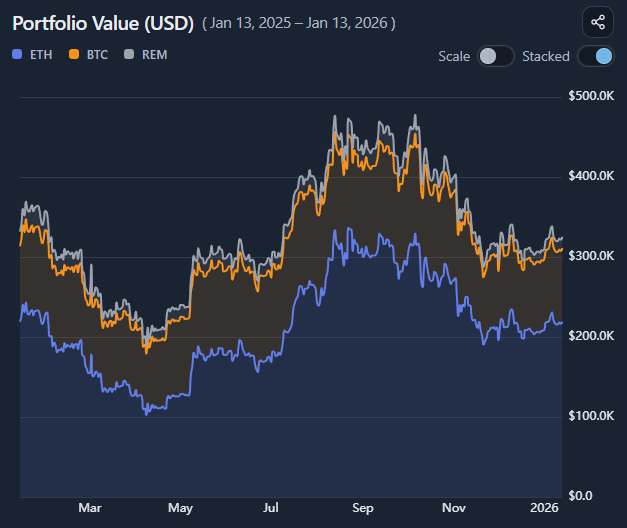
  • Which positions drove growth or drawdowns?
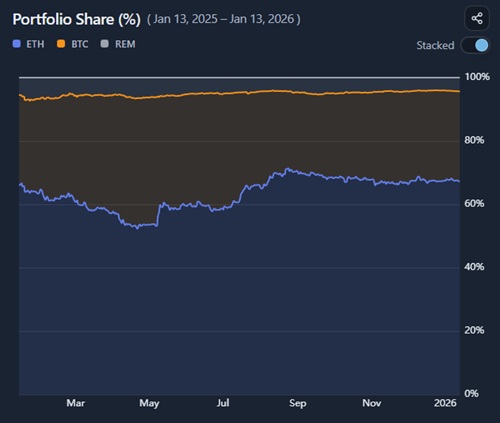
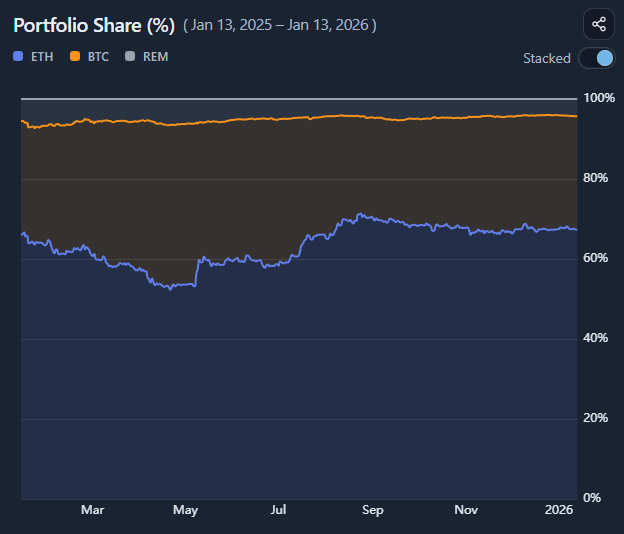
  • How did allocation change over time?
  • Did performance come from concentration or balance?

Portfolio Development separates absolute value change from relative position share, making portfolio dynamics explicit.

What you’re looking at

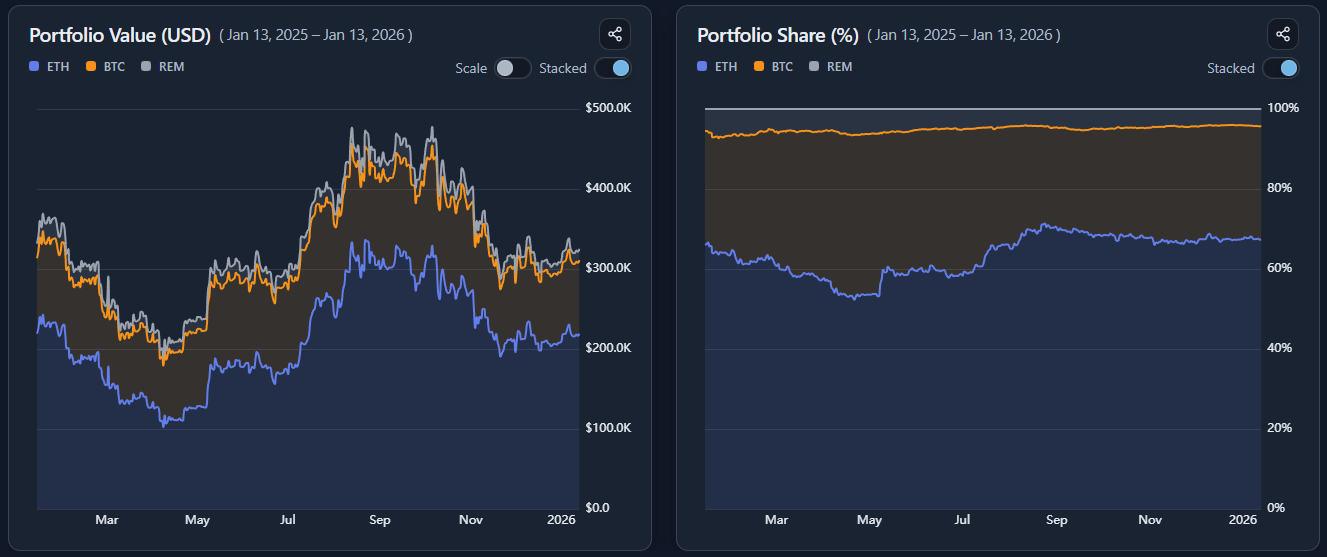
This page consists of two linked charts:

  • a Value chart, showing absolute portfolio value broken down by position
  • a Share (%) chart, showing each position’s relative weight over time

Both charts describe the same portfolio, but from different perspectives.

Absolute value vs relative share

Value (USD)

  • shows how much each position contributes in dollar terms
  • highlights growth, drawdowns, and volatility
  • answers: “Where did the money come from (or go)?”

Share (%)

  • shows how portfolio weight shifts over time
  • highlights concentration, drift, and dominance
  • answers: “How important is each position relative to the rest?”

A position can grow in value while losing share if others grow faster.

Stacked vs individual views

You can view both charts as either stacked or individual lines.

Stacked view

  • shows the total portfolio as a whole
  • emphasizes composition and aggregate movement
  • useful for understanding concentration effects

Individual lines

  • isolate each position’s trajectory
  • make comparisons and crossovers clearer
  • useful for spotting divergence between holdings

Switching views reveals structure that a single chart cannot.

Reading allocation drift and concentration

Use the Share (%) chart to observe:

  • gradual drift driven by relative price performance
  • periods where one position dominates portfolio behavior
  • changes in diversification without any trades

Allocation changes here are mechanical — driven by price, not rebalancing.

Common misinterpretations

This does not show trading history
It assumes static holdings throughout the period.

Rising share does not imply deliberate allocation
It reflects relative performance, not intent.

Autoscaling changes perspective, not results
It zooms the view but does not alter values.

When to use and when not to use

Most useful for

  • understanding portfolio dynamics
  • diagnosing concentration risk
  • comparing contributions across positions
  • complementing point-in-time portfolio summaries

Not suitable for

  • evaluating trading skill
  • tax or accounting purposes
  • modeling active rebalancing strategies

Key takeaways

  • Value and share tell different stories
  • Performance and concentration are not the same
  • Allocation can drift without trades
  • Structure matters as much as outcomes

How to use

Selecting a portfolio

Choose a portfolio you previously defined.

All charts are derived from:

  • your entered quantities
  • your defined cost basis
  • historical and current prices

Reading the value chart

The Value chart shows absolute portfolio value over time, broken down by position.

Use it to:

  • see total growth and drawdowns
  • identify which positions drove changes
  • compare contribution in dollar terms

Reading the share (%) chart

The Share chart shows each position’s percentage of total portfolio value.

Use it to:

  • monitor concentration
  • observe allocation drift
  • understand relative importance over time

Using stacked and line modes

Toggle between:

  • stacked mode to view the portfolio as a whole
  • line mode to compare individual positions

Both views use the same data but emphasize different structure.

Using autoscale

Enable autoscaling to remove the forced zero baseline.

This helps:

  • inspect smaller movements
  • compare assets with very different value ranges
  • avoid flattening important variation

Autoscaling affects only visual framing.

Example workflow

  1. Select a portfolio
  2. Start in stacked value view to see total evolution
  3. Switch to line view to compare positions
  4. Check share (%) to assess concentration drift
  5. Toggle autoscale to inspect subtle shifts
Portfolio Development preview

Try it yourself

Portfolio Development

Use the interactive tool to explore the same concept with your own time range and settings.