Compare relative performance, visualization return structures, and spot momentum shifts.
Real-time prices, sparklines, and market-cap-ranked market overview.
Candles, indicators, log or linear, multi-interval views.
Normalize two assets to 100 and compare leaders.
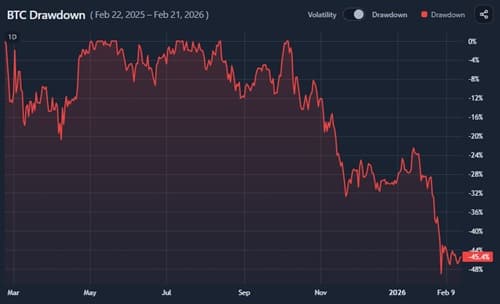
Rolling volatility, drawdown, and tail-risk diagnostics for one asset.
Daily return heatmap with top and bottom day impact.
Monthly or quarterly returns across years and averages.