Interpretation
What problem this simulator solves
Investors often debate whether it’s better to:
- invest everything at once (HODL / lump sum), or
- spread investments over time (DCA)
Both approaches feel intuitive, but their outcomes depend heavily on timing, volatility, and trend direction.
This simulator makes that trade-off explicit by replaying both strategies over the same historical price path.
What you’re looking at

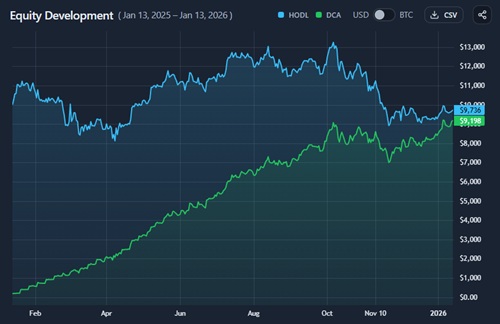
The simulator compares two investment paths for the same asset and time range:
- HODL
The full amount is invested on the first day and held throughout. - DCA
The same total amount is invested gradually in equal tranches on a fixed cadence.
Both paths are priced using actual historical prices.
How HODL and DCA differ conceptually
HODL (lump sum)
- Maximizes time in the market
- Benefits most from strong uptrends starting early
- Exposes you fully to short-term drawdowns
DCA (dollar-cost averaging)
- Reduces timing risk
- Buys more units during dips
- Often underperforms in strong, steady uptrends
This simulator does not assume one is better — it shows when and why one wins.
How to interpret the results panel

The results panel compares HODL vs DCA across four dimensions:
- End Value
Final portfolio value at the end of the period - P&L
Absolute and percentage profit or loss vs invested capital - Units acquired
How many coins each strategy accumulated - Average price
The effective average entry price
The highlighted winner simply reflects which strategy ended with higher value, not which is “correct.”
What this does (and does not) tell you
This simulator shows:
- sensitivity to entry timing
- the cost of missing early upside
- how volatility affects accumulation
It does not:
- predict future performance
- recommend a universal strategy
- account for taxes, fees, or execution constraints
Results are path-dependent, not general rules.
Common misinterpretations (important)
- “DCA is safer”
DCA reduces timing risk, not downside risk. - “HODL always wins in crypto”
Only if the uptrend starts early in the period. - “This tells me which strategy is better”
It tells you which strategy would have won for this asset and timeframe.
When this simulator is most useful
- Comparing strategies during volatile periods
- Stress-testing lump-sum entries
- Understanding the cost of waiting
- Educating investors on path dependency
Key takeaways
- Strategy performance is highly path-dependent
- HODL benefits early trends
- DCA smooths entry but can miss upside
- There is no universally superior approach
How to use
Selecting asset and date range
You can:
- choose one asset
- set a custom date range or quick range
- switch assets to compare different regimes
Both strategies always use the same dates and prices.
Configuring the investment

Set:
- Total investment amount
- DCA interval (daily / weekly / monthly, etc.)
- Execution day (e.g. Monday for weekly DCA)
The total amount is identical for both strategies.
Reading the equity development chart
The chart shows:
- HODL equity curve (lump sum invested upfront)
- DCA equity curve (capital deployed gradually)
This makes timing effects and volatility exposure immediately visible.
Interpreting the comparison outcome
Use the results panel to understand:
- why one strategy won
- whether the difference came from price timing or accumulation
- how much volatility mattered
Small differences often mean strategy choice mattered less than regime.
Switching between fiat value and units view
By default, the equity chart shows portfolio value in fiat (USD).
You can switch the view to crypto units (e.g. BTC) using the currency toggle.

In crypto view:
- The chart shows the cumulative amount of the asset held over time
- HODL appears as a flat line (all units acquired on day one)
- DCA appears as a step-like increase as units are accumulated gradually
This view removes price effects entirely and focuses on accumulation behavior.
Use it to answer:
- “How many coins did I actually end up with?”
- “Did DCA accumulate more units than HODL?”
- “How much of the difference is price vs timing?”
Switching between fiat and units helps separate value outcomes from quantity outcomes, which is critical when comparing lump sum vs DCA.
Example workflow
A simple way to use the tool:
- Select BTC and a volatile period
- Run HODL vs weekly DCA
- Observe equity curves divergence
- Check units acquired and average price
- Change the date range and repeat
Patterns emerge quickly when you test multiple regimes.
