Interpretation
What problem this visualization solves
Once you hold multiple assets, it becomes hard to answer simple questions:
- What is my portfolio worth right now?
- How much am I up or down relative to what I paid?
- Which assets are actually driving changes?
- How has my portfolio evolved over time?
The Portfolio Tracker answers these by pricing your holdings against current market prices and comparing them to your cost basis.
What you’re looking at
This page shows a mark-to-market view of a portfolio you defined elsewhere.
It combines:
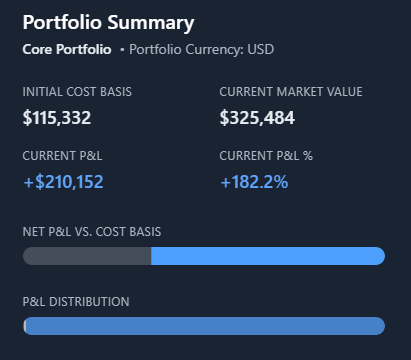
- a portfolio summary (value and P&L)
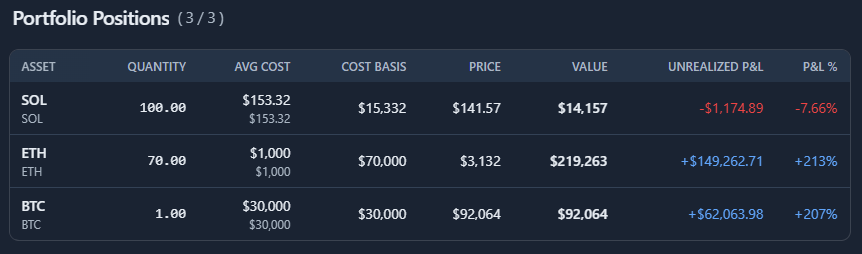
- a positions table (per-asset breakdown)
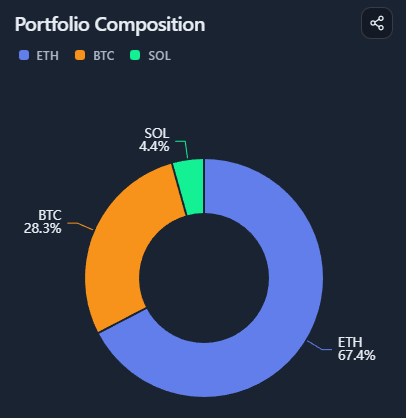
- a composition donut (allocation)
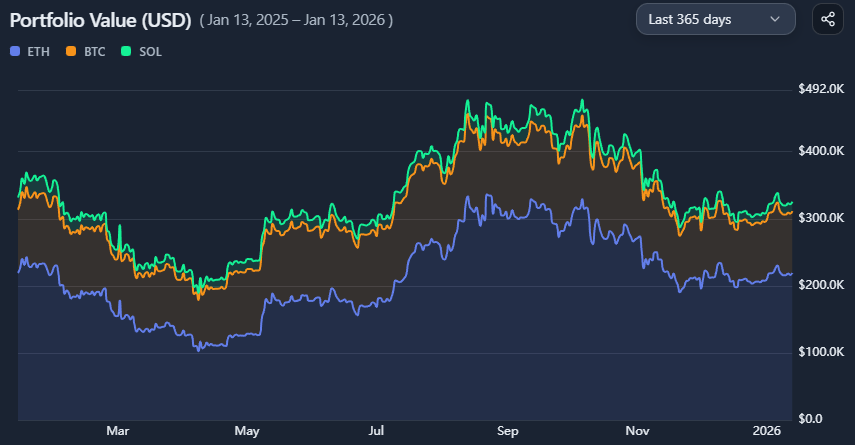
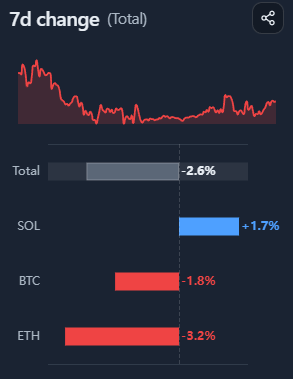
- a portfolio value time series
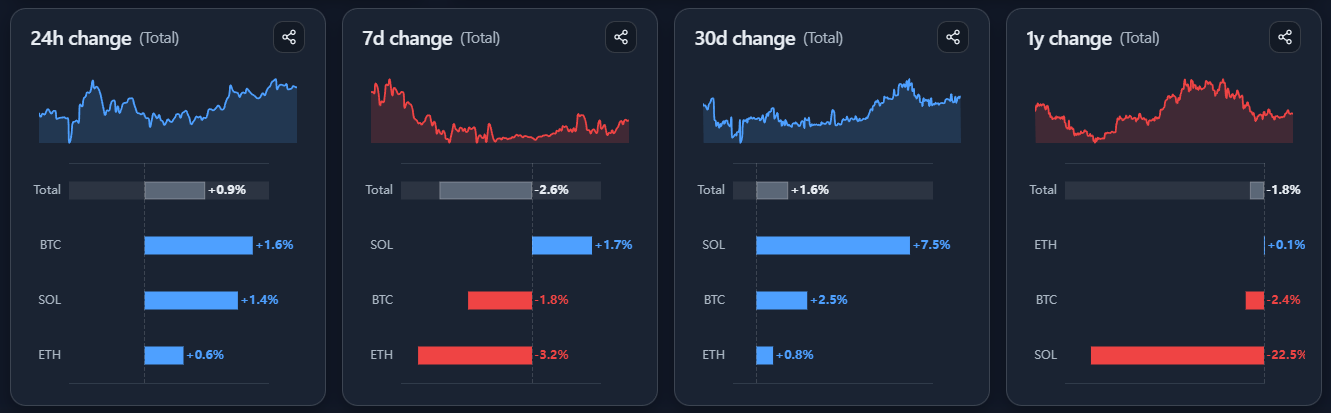
- delta summaries by asset across multiple horizons
All metrics are derived from your entered quantities and cost basis, priced with live market data.
Cost basis vs market value

Two concepts drive all calculations:
Cost basis
- what you originally paid for each position
- fixed unless you update the portfolio
Market value
- current value based on live prices
- changes continuously with the market
The difference between the two is your unrealized P&L.
This tool does not model trades, timing, or rebalancing — it reflects current valuation, not realized performance.
Interpreting P&L and allocation

Unrealized P&L
- shows gains or losses if positions were marked today
- can be positive even during market drawdowns
- can be negative even in rising markets (depending on entry)
Allocation
- shows how portfolio weight is distributed across assets
- shifts automatically as prices move
- can drift significantly from original intent
Tracking both helps separate price movement from position sizing.
Portfolio value over time

The portfolio value chart reconstructs how the portfolio’s total value evolved over the selected timeframe.
It:
- uses current holdings throughout the period
- applies historical prices to those quantities
- does not assume interim trades or rebalancing
This answers:
“If I held this portfolio composition, how would its value have changed over time?”
Short-term deltas vs long-term position

The delta section breaks down changes across multiple horizons (24h, 7d, 30d, 1y).
This helps identify:
- which assets are driving recent moves
- whether short-term noise aligns with long-term trends
- how contributions differ by timeframe
Short-term deltas explain what just happened, not whether the portfolio is “good” or “bad”.
Common misinterpretations
This is not a trade ledger
Realized P&L depends on execution and timing, which are not modeled here.
Historical value assumes static holdings
It shows valuation evolution, not trading history.
Positive P&L does not imply optimal allocation
It reflects outcomes, not risk-adjusted decisions.
When to use and when not to use
Most useful for
- tracking portfolio health
- monitoring unrealized P&L
- understanding allocation drift
- identifying drivers of recent changes
Not suitable for
- tax or accounting purposes
- evaluating trading skill
- modeling active rebalancing strategies
Key takeaways
- Portfolios are priced against live markets
- Cost basis anchors P&L interpretation
- Allocation changes even without trades
- Different timeframes reveal different drivers
How to use
Selecting a portfolio
Choose a portfolio you previously defined in > User Pill > Portfolios.
Portfolios consist of:
- asset
- quantity
- average cost basis
All calculations on this page use that definition.
Reading the portfolio summary and positions

The summary shows:
- initial cost basis
- current market value
- unrealized P&L (absolute and %)
The positions table breaks this down per asset, including:
- quantity
- average cost
- current price
- current value
- unrealized P&L
Understanding portfolio composition

The composition donut shows current allocation by asset.
Because it is based on market value, allocation changes automatically as prices move — even if you make no trades.
Use it to monitor concentration and drift.
Using the portfolio value chart

Select a timeframe to view portfolio value over time.
This chart:
- applies historical prices to current holdings
- shows how total value evolved
- helps contextualize drawdowns and recoveries
Reading the delta summary

At the bottom, each timeframe shows:
- a sparkline of total portfolio movement
- per-asset contribution bars
Use this to quickly see:
- which assets drove recent changes
- whether moves are broad or concentrated
Example workflow
- Select a portfolio
- Review total P&L vs cost basis
- Check allocation for concentration risk
- Inspect portfolio value over time
- Use delta summaries to identify drivers