BlockViz
GuidesSimulatorsSell & Buy Back Simulator

Sell & Buy Back Simulator

Test a trim-and-rebuy plan vs simply holding a position.

Open tool →

Interpretation

What problem this simulation solves

Many investors trim positions during strength and plan to buy back later.

The core question is not just:

“Did I make more money?”

but also:

“Did trimming improve or hurt my ability to rebuild the position?”

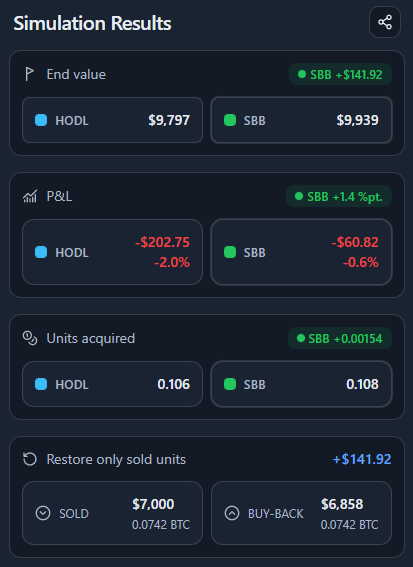
Sell & Buy Back makes this explicit by comparing a do-nothing Hold against a partial sell + later rebuy, measured both in fiat and in crypto units.

What you’re looking at


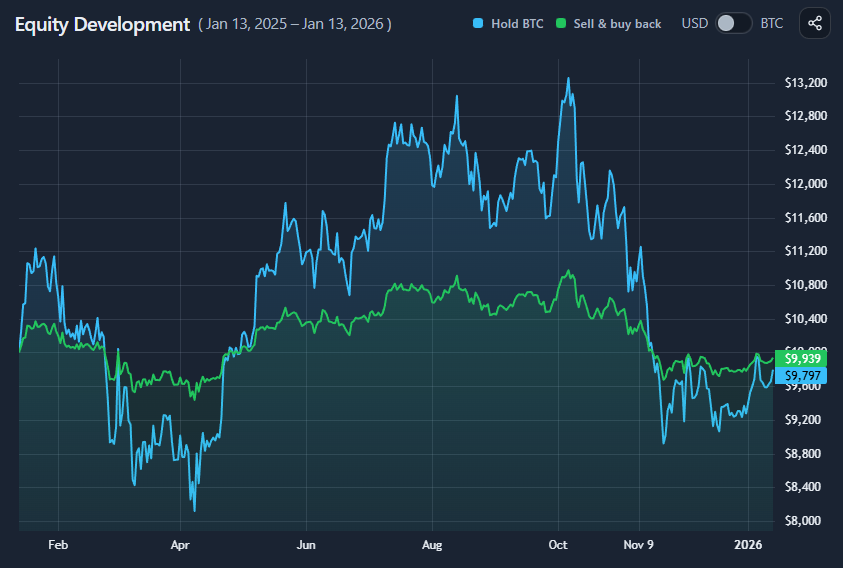
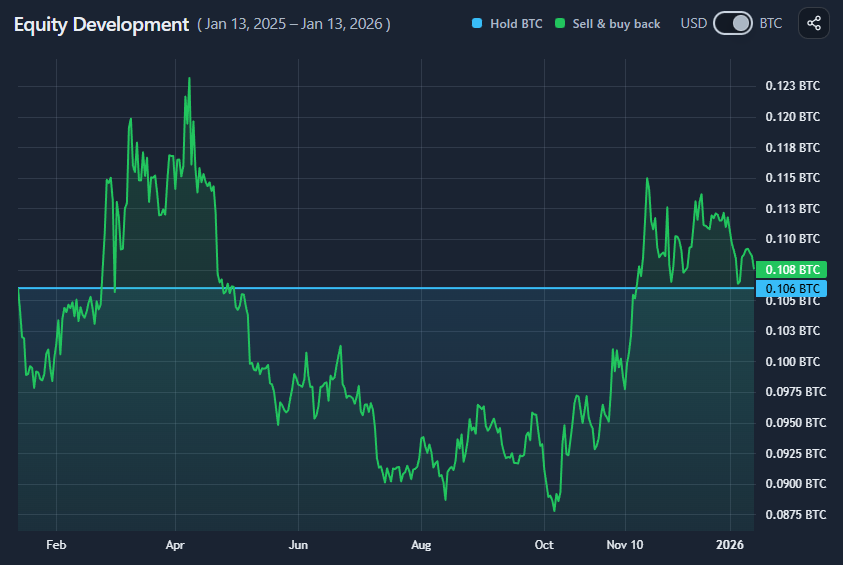
You are comparing two paths over the same time period:

  • Hold
    Keep the entire position unchanged.
  • Sell & Buy Back (SBB)
    Sell a specified portion of the position at the start, hold that portion in fiat, then buy back later.

Both paths start with the same initial position.

Fiat outcomes vs coin outcomes

This simulator intentionally separates two perspectives:

  • USD view
    Shows portfolio value over time and final P&L in fiat terms.
  • Base-coin view (e.g. BTC)
    Shows how many coin units you end up holding.

A trim can:

  • Reduce drawdowns and improve USD outcomes
  • Yet still leave you with fewer coins
  • Or conversely, increase coin units even if fiat gains are modest

Neither view is sufficient alone.

Reading the results panel

The results panel summarizes:

  • End value (USD)
    Final portfolio value for Hold vs SBB.
  • P&L
    Absolute and percentage profit or loss.
  • Units acquired
    Total coin units held at the end.

This makes it clear whether trimming helped in value terms, coin terms, or both.

“Restore only sold units” explained

By default, the SBB path assumes:

  • You spend all sold fiat to buy back in.

The Restore only sold units section answers a different question:

“How much fiat would I have needed to repurchase only the coins I originally sold?”

It shows:

  • The fiat received from selling
  • The fiat required to buy back the same number of coin units later

If the required buy-back amount is lower, the trim improved your ability to restore exposure.
If it is higher, trimming was costly in hindsight.

What this does not imply

This is not a timing strategy.

  • The sell and buy-back points are fixed by the simulation window.
  • No prediction, signals, or optimization are involved.
  • Fees, taxes, and execution effects are ignored.

This tool explains consequences, not decisions.

When this simulation is most useful

  • Evaluating past trim decisions
  • Understanding the trade-off between drawdown control and coin accumulation
  • Comparing “risk reduction” vs “stacking” outcomes
  • Stress-testing discretionary sell instincts

Key takeaways

  • Trimming can reduce drawdowns without necessarily improving long-term returns.
  • Better USD outcomes do not guarantee more coins.
  • The cost of trimming is often paid in missed upside, not realized loss.
  • The ability to restore sold units matters more than short-term P&L.
  • Sell & Buy Back reframes trimming as an exposure-management trade-off, not a timing win.

The value of this simulation is understanding what trimming really buys you — and what it quietly costs.

How to use

Selecting asset and position size

You configure:

  • The asset
  • The starting position size
  • The sell amount (partial trim)
  • The date range

The sell happens at the start of the period; the buy-back happens at the end.

Reading the equity development chart

The chart compares:

  • Hold — full position throughout
  • Sell & Buy Back — trimmed position plus rebuy

You can switch between:

  • USD view to track fiat value
  • Base-coin view to track coin units

In base-coin view:

  • Hold is flat (units unchanged)
  • SBB shows how trimming and rebuy affected final coin count

Interpreting the restore comparison

Use the Restore only sold units section to answer:

  • “Did trimming make it easier or harder to get back to my original position?”
  • “How much fiat flexibility did the trim really create?”

This reframes trimming as a position-recovery problem, not just a profit calculation.

Example workflow

A simple way to use the tool:

  • Select BTC and a volatile year
  • Trim a meaningful portion (e.g. 30–50%)
  • Compare USD outcomes
  • Switch to BTC view to check unit impact
  • Inspect the restore section to see if trimming actually helped

This quickly reveals whether trimming reduced risk without sacrificing long-term exposure.

Sell & Buy Back preview

Try it yourself

Sell & Buy Back

Use the interactive tool to explore the same concept with your own time range and settings.