BlockVizBlockViz
Price
Market Cap
Portfolio
Simulators
Resources
Pricing

Price

  • KPI Tracker
  • Techn. Analysis Chart
  • Indexed Comparison
  • Asset Risk Analyzer
  • Best & Worst Days
  • Seasonality Heatmap

Market Cap

  • Dominance
  • Development
  • Treemap

Portfolio

  • Tracker
  • Development
  • Comparison
  • Risk Analyzer

Simulators

  • Market Cap Parity
  • HODL vs. DCA
  • Coin Flip
  • Sell and Buy Back
  • Stop Loss
  • Portfolio Rebalance

Resources

  • Coins
  • Guides
  • Wiki
  • Blog
  • News

Community

X.comCMCBinanceYouTubeLinkedInDiscord

Product

PricingRewardsPartnersAll Tools

Resources

CoinsGuidesWikiNews

Company

AboutContactSupportLegal

Data provided by

CoinGecko

© 2026 BlockViz.xyz
All rights reserved.

Home
›News

Latest News

Home
›News
›Bitcoin down 59K since October: is March the sixth red month in a row?
Bitcoin down 59K since October: is March the sixth red month in a row?

Bitcoin down 59K since October: is March the sixth red month in a row?

March 2, 2026|By BlockViz Insights
BTC

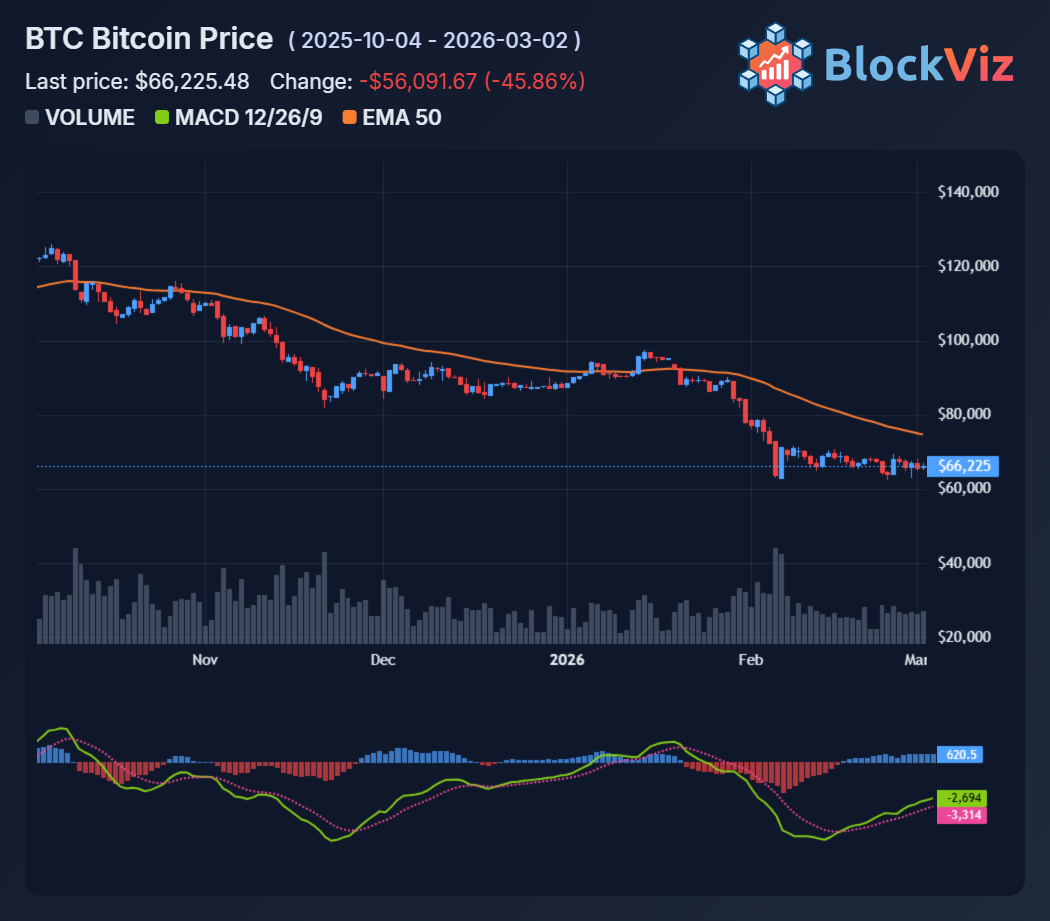
From an October high near 126,000 dollars to the mid‑60,000s today, $BTC Bitcoin has given back close to half its value. Five consecutive red months have compressed risk appetite across crypto, forced systematic de‑leveraging and pushed many active traders to the sidelines. This is exactly the kind of tape that feels untradeable for trend followers and too scary for dip‑buyers.

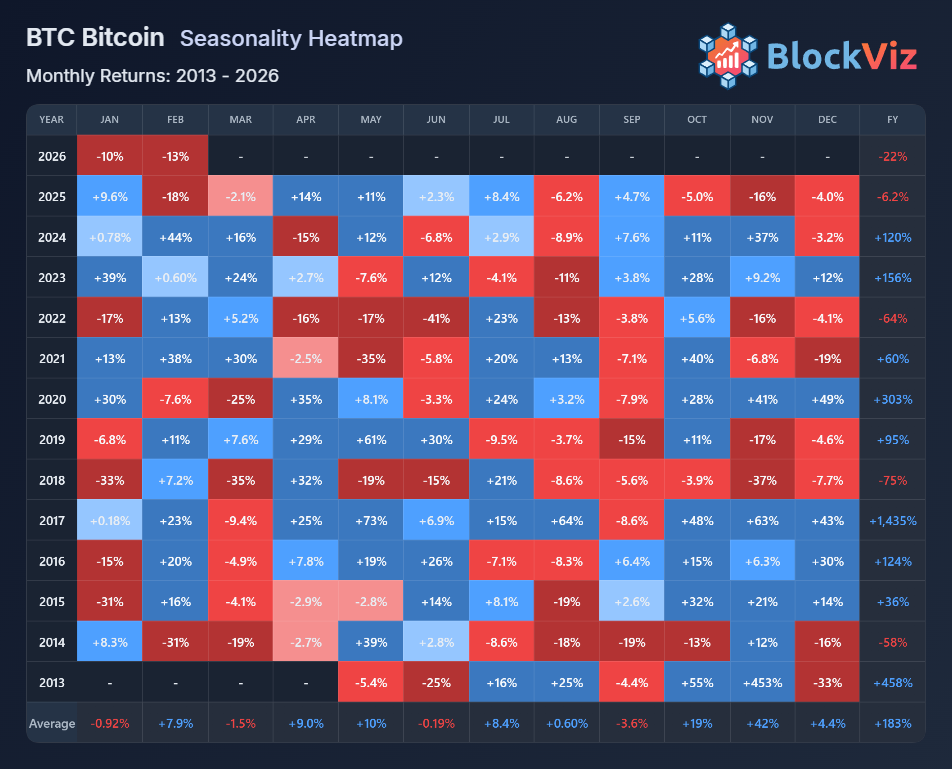
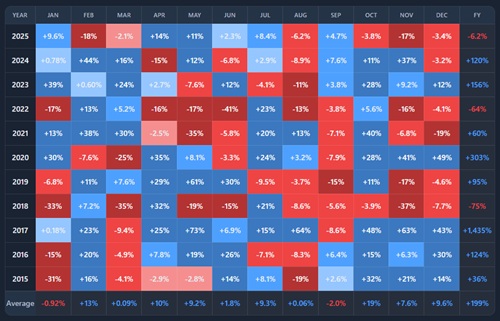
So what if March locks in a sixth month of losses? First, it would confirm that we are in a full drawdown phase, not a brief correction. That means narratives anchored to the last all‑time high are still a liability. Second, the market is quietly shifting ownership: short‑term holders are exiting at a loss while longer‑horizon capital accumulates at structurally lower prices. Price weakness can coexist with improving underlying holder quality.

For a trader or allocator, treating this as “late bear, early accumulation” can be more productive than trying to call the bottom tick. It suggests three practical moves: size positions for higher volatility, extend time horizons beyond the next headline and focus on asymmetric entries where forced sellers create liquidity. If March does print the sixth red candle, it will not be a signal to give up on Bitcoin. It will be proof that the easy phase of the cycle is over, and that returns from here will belong to those who can stay systematic while everyone else is reacting to the chart.

Seasonality Heatmap preview

Explore this related tool

Seasonality Heatmap

Use the interactive tool to explore the same concept with your own time range and settings.

Related Tool
Seasonality Heatmap

Seasonality Heatmap

Open Tool →

More News
Bitcoin Stuck Between 65k and 78k: Which Side Breaks First?

Bitcoin Stuck Between 65k and 78k: Which Side Breaks First?

Mar 5, 2026
Iran War driving Oil and USD up, what's next for Bitcoin?

Iran War driving Oil and USD up, what's next for Bitcoin?

Mar 3, 2026
Bear Market Altseason Signals: Can Alts Run While Fear Stays High?

Bear Market Altseason Signals: Can Alts Run While Fear Stays High?

Feb 27, 2026
Jane Street Trading Leak Triggers Bitcoin Rebound Above $65K

Jane Street Trading Leak Triggers Bitcoin Rebound Above $65K

Feb 25, 2026