BlockVizBlockViz
Price
Market Cap
Portfolio
Simulators
Resources
Pricing

Price

  • KPI Tracker
  • Techn. Analysis Chart
  • Indexed Comparison
  • Asset Risk Analyzer
  • Best & Worst Days
  • Seasonality Heatmap

Market Cap

  • Dominance
  • Development
  • Treemap

Portfolio

  • Tracker
  • Development
  • Comparison
  • Risk Analyzer

Simulators

  • Market Cap Parity
  • HODL vs. DCA
  • Coin Flip
  • Sell and Buy Back
  • Stop Loss
  • Portfolio Rebalance

Resources

  • Coins
  • Guides
  • Wiki
  • Blog
  • News

Community

X.comCMCBinanceYouTubeLinkedInDiscord

Product

PricingRewardsPartnersAll Tools

Resources

CoinsGuidesWikiNews

Company

AboutContactSupportLegal

Data provided by

CoinGecko

© 2026 BlockViz.xyz
All rights reserved.

Home
›News

Latest News

Home
›News
›Jane Street Trading Leak Triggers Bitcoin Rebound Above $65K
Jane Street Trading Leak Triggers Bitcoin Rebound Above $65K

Jane Street Trading Leak Triggers Bitcoin Rebound Above $65K

February 25, 2026|By BlockViz Insights
BTC

Bitcoin surged past $66,000 on February 25, 2026, after investor Mike Alfred leaked details from a Jane Street insider. The contact revealed that management ordered an immediate shutdown of "manipulative" $BTC trading algorithms late the previous night. This development ended weeks of rumored daily pressure from the firm.

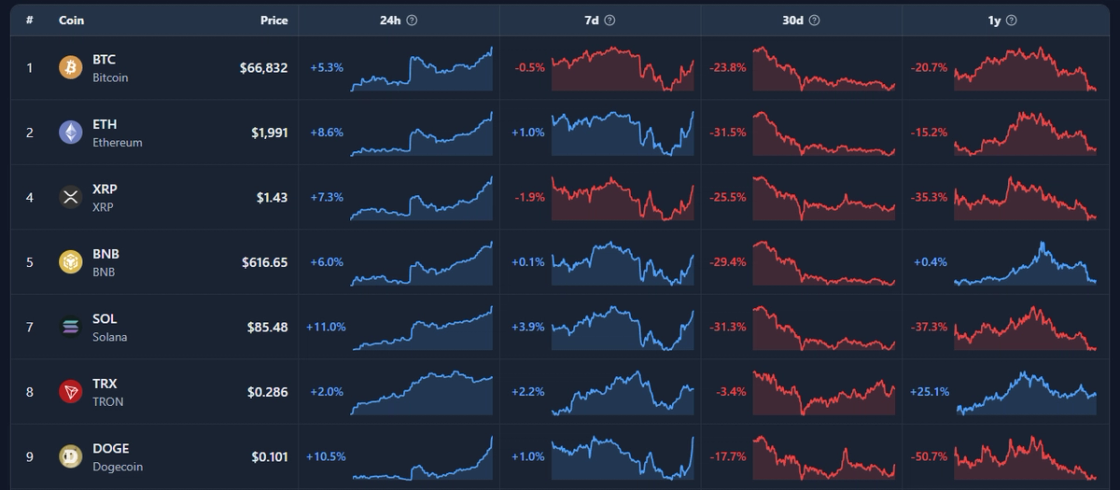
Jane Street serves as a primary market maker for BlackRock's IBIT ETF, managing over $790 million in holdings. Persistent rumors accused the firm of executing 10 a.m. ET dumps to trigger liquidations and accumulate BTC at lower prices. These patterns had capped price action below $65K despite broader market inflows. Today's session marked the first notable absence of such morning selling, fueling a 3-5% rally through short covering.

The timing aligns with a lawsuit filed last week, alleging Jane Street's involvement in insider trading during the 2022 Terra collapse. Such claims amplify scrutiny on the firm's $40 billion-plus trading operations and their impact on crypto markets.

Historically, $65K has functioned as fragile support amid ETF volatility and macro headwinds. The algo pause suggests potential for steadier bids if institutional selling subsides. BTC now tests resistance near recent highs, with traders monitoring flows and regulatory responses for sustained direction.

KPI Tracker preview

Explore this related tool

KPI Tracker

Use the interactive tool to explore the same concept with your own time range and settings.

Related Tool
KPI Tracker

KPI Tracker

Open Tool →

More News
Bitcoin’s Lowest Weekly RSI Ever: What It Means for the 60K Level

Bitcoin’s Lowest Weekly RSI Ever: What It Means for the 60K Level

Feb 24, 2026
Vitalik dumps more ETH - as it goes below 2k

Vitalik dumps more ETH - as it goes below 2k

Feb 23, 2026
Ethereum's Long Dominance Slide: From 30% Peak to sub-10% today

Ethereum's Long Dominance Slide: From 30% Peak to sub-10% today

Feb 21, 2026
Bitcoin Edges Toward 70K – A Buy or Sell Moment?

Bitcoin Edges Toward 70K – A Buy or Sell Moment?

Feb 20, 2026