BlockVizBlockViz
Price
Market Cap
Portfolio
Simulators
Resources
Pricing

Price

  • KPI Tracker
  • Techn. Analysis Chart
  • Indexed Comparison
  • Asset Risk Analyzer
  • Best & Worst Days
  • Seasonality Heatmap

Market Cap

  • Dominance
  • Development
  • Treemap

Portfolio

  • Tracker
  • Development
  • Comparison
  • Risk Analyzer

Simulators

  • Market Cap Parity
  • HODL vs. DCA
  • Coin Flip
  • Sell and Buy Back
  • Stop Loss
  • Portfolio Rebalance

Resources

  • Coins
  • Guides
  • Wiki
  • Blog
  • News

Community

X.comCMCBinanceYouTubeLinkedInDiscord

Product

PricingRewardsPartnersAll Tools

Resources

CoinsGuidesWikiNews

Company

AboutContactSupportLegal

Data provided by

CoinGecko

© 2026 BlockViz.xyz
All rights reserved.

Home
›News

Latest News

Home
›News
›Iran War driving Oil and USD up, what's next for Bitcoin?
Iran War driving Oil and USD up, what's next for Bitcoin?

Iran War driving Oil and USD up, what's next for Bitcoin?

March 3, 2026|By BlockViz Insights
BTC

Brent and WTI have jumped sharply as Middle East supply risks grow, with analysts now openly discussing triple‑digit crude if disruptions persist. At the same time the dollar index has climbed back toward the high 90s on safe‑haven flows and fading expectations of near‑term Fed cuts. Higher energy costs plus a stronger dollar point to renewed inflation pressure and tighter financial conditions, a mix that historically weighs on long‑duration risk assets.

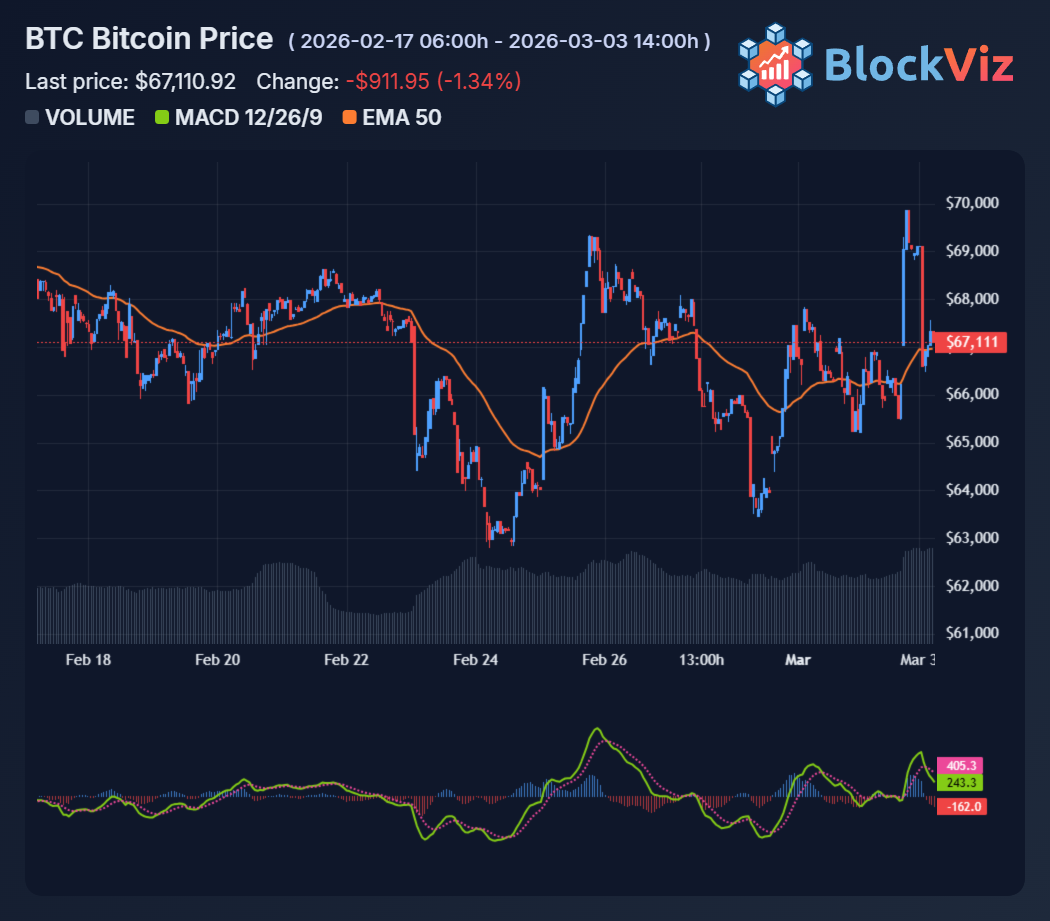
So where does that leave $BTC ? In the short run, it trades the liquidity cycle. A firmer dollar and rate‑cut repricing reduce excess liquidity, so Bitcoin’s first response tends to be volatility and selling pressure, not instant “digital gold” behavior. You can already see this in intraday price action: knee‑jerk spikes on war headlines that fade as funding costs and macro hedging flows dominate.

The medium‑term picture is more nuanced. Persistent geopolitical stress that keeps oil elevated and real yields capped can support the store‑of‑value narrative, but only after the market finishes de‑leveraging. For traders, the practical playbook is clear: respect the macro tape, assume higher realized volatility, and separate timeframes. Use strength into dollar spikes to de‑risk leveraged exposure, and look to accumulate only where forced sellers meet your longer‑horizon thesis, not just because “war is good for Bitcoin.”

Technical Analysis Chart preview

Explore this related tool

Technical Analysis Chart

Use the interactive tool to explore the same concept with your own time range and settings.

Related Tool
Technical Analysis Chart

Technical Analysis Chart

Open Tool →

More News
Bitcoin Bull Trap: Was $74K the Local Peak Before Pain?

Bitcoin Bull Trap: Was $74K the Local Peak Before Pain?

Mar 6, 2026
Bitcoin Stuck Between 65k and 78k: Which Side Breaks First?

Bitcoin Stuck Between 65k and 78k: Which Side Breaks First?

Mar 5, 2026
Bitcoin down 59K since October: is March the sixth red month in a row?

Bitcoin down 59K since October: is March the sixth red month in a row?

Mar 2, 2026
Bear Market Altseason Signals: Can Alts Run While Fear Stays High?

Bear Market Altseason Signals: Can Alts Run While Fear Stays High?

Feb 27, 2026