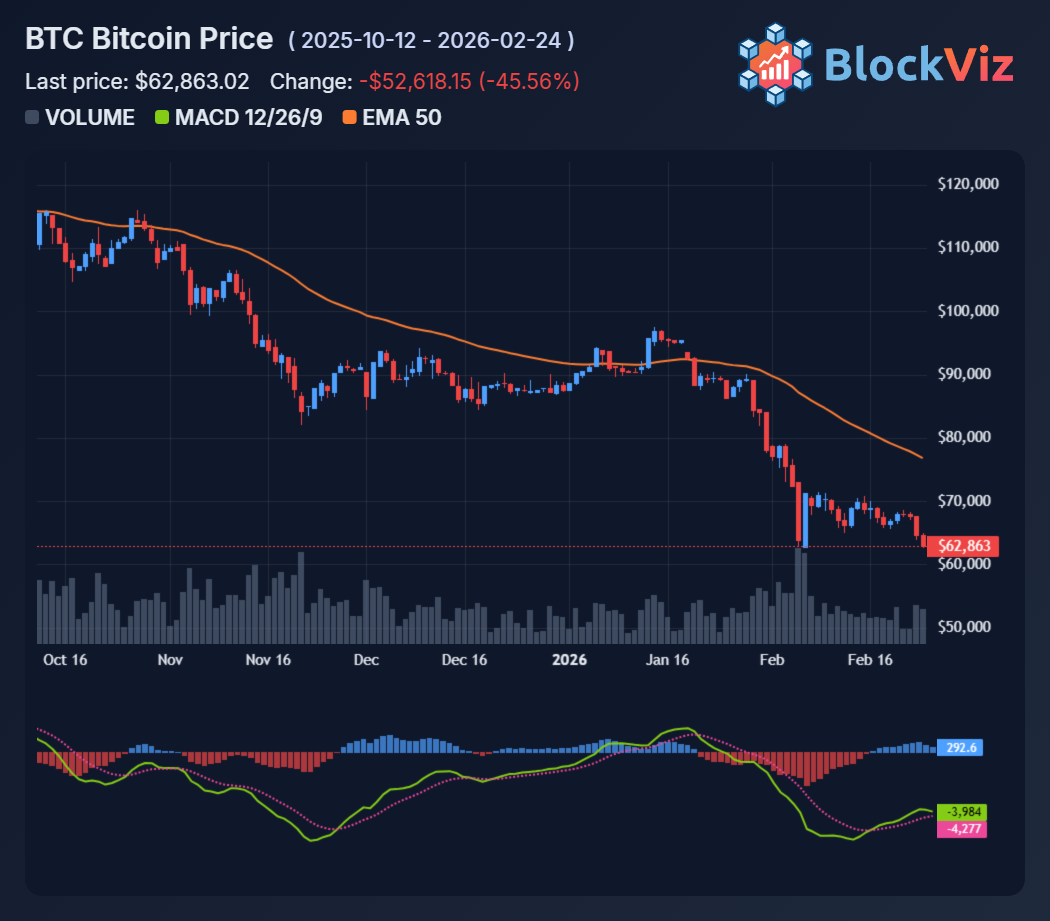
Bitcoin’s weekly RSI has dropped to its most oversold reading in history while price hovers around the 60,000 dollar support. Here is how I’m thinking about the next moves.
For context, the current selloff has already retraced more than half of the move from the late‑2025 peak near 126,000 dollars, pushing $BTC into a zone where prior cycles have often formed major bases. At the same time, on‑chain and derivatives data point to forced deleveraging, miner margin pressure and a clear shift from aggression to capital preservation.
From a trading perspective, I see three key scenarios:
- 60,000 dollar holds, weekly RSI mean‑reverts and we rotate into a choppy accumulation range, rewarding staggered spot entries and conservative covered calls.
- 60,000 dollar breaks convincingly, turning 58,000 to 60,000 dollars into resistance and opening the way toward deeper value zones where only patient laddered bids make sense.
- A “V‑plus‑grind” structure where an initial sharp bounce off support is followed by several weeks of sideways consolidation that resets funding and sentiment before any sustainable trend resumes.
In all cases, my playbook here is simple: respect the historic RSI signal, size positions for elevated volatility and treat 60,000 dollars not as a line to predict, but as a line to manage risk around.