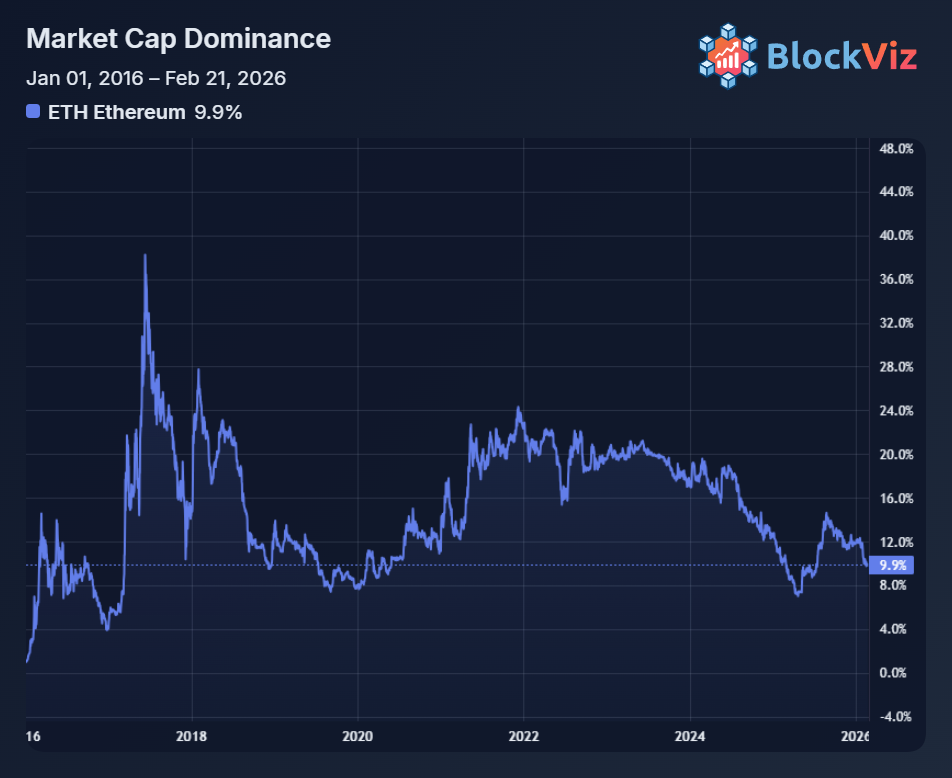
Ethereum dominance has plummeted over the last 10 years. From a 2017 peak above 30% to under 10% today. $BTC re-asserting its king position, "the flippening" narrative off the table, and reflecting crypto's explosion into a multi-chain world.
2016–2026 Timeline
• 2016–2017: ETH launches ~2–3% dominance; ICO boom rockets it to 25–31% peak by mid-2017 as smart contracts go viral.
• 2018–2020: Bear markets and BTC recovery drag it back to single digits, bottoming ~7% around 2018–19.
• 2021: DeFi/NFT hype lifts to 14–20% range, but never retests prior highs.
• 2022–2024: L1/L2 rivals erode share amid bears; settles mid-teens at best.
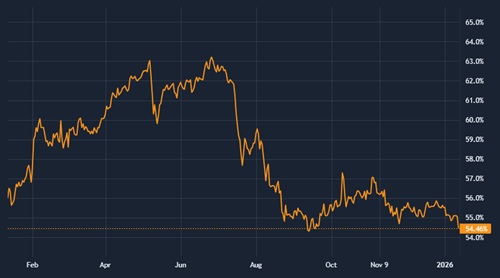
• 2025–Feb 2026: BTC dominance climbs ~60%, alts fragment: ETH hits ~9%, as your BlockViz chart shows.
Key Drivers
• Rise of alternatives: Solana, Base, and 100+ L2s/tokenize value outside pure ETH cap, despite Ethereum's foundational role in DeFi/stables.
• BTC macro bet: ETF flows and "digital gold" narrative concentrate ~2/3 of market in BTC.
• ETH strength hidden: Still #1 in TVL, deflationary, upgrade machine, but dominance measures price share, not utility.
Nevertheless the constant slide down from the end of '21 intermediate peak to today's sub-10% range, is a stark reminder that value capture in crypto's competitive world remains a struggle.