Spot Bitcoin ETFs have logged a multiweek stretch of redemptions large enough to rival the worst periods of the last cycle. This is not just intraday noise, it is a clear sign that larger players are taking down risk, unwinding basis trades and rotating out of the most crowded crypto exposures. When that happens, price tends to respect liquidity, not narratives.
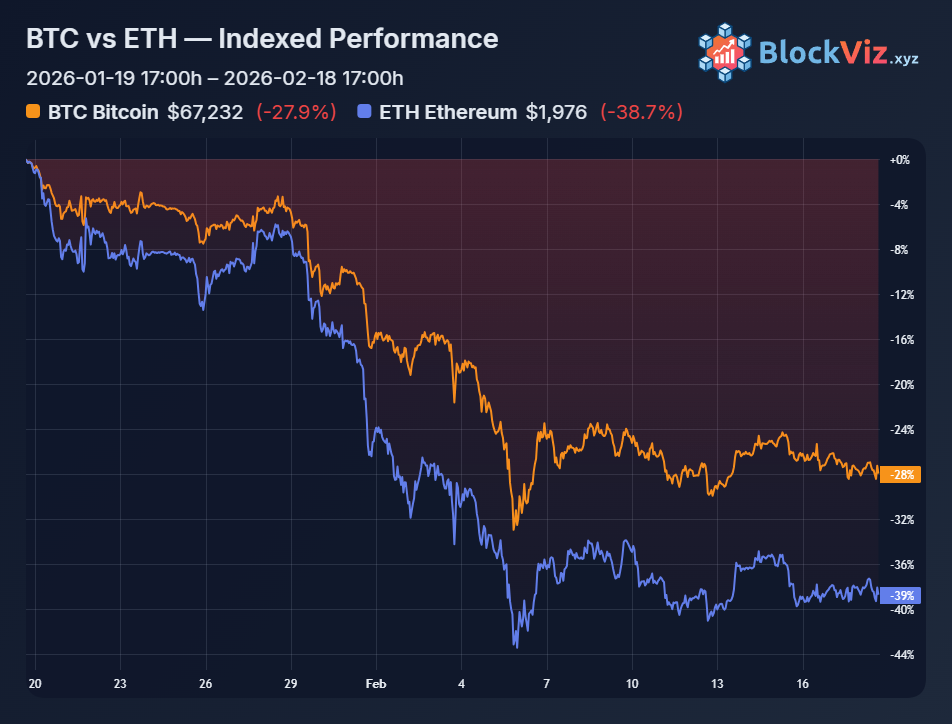
For $BTC , that pressure shows up in price repeatedly losing momentum near recent highs and grinding back toward areas where prior ETF demand absorbed supply. If those zones fail on convincing volume, the message is simple: balance-sheet buyers are no longer defending these levels, and the market will have to discover a lower equilibrium before new capital steps in. That is exactly how late-cycle drawdowns usually start.
$ETH looks even more vulnerable. Ethereum spot products have seen consistent outflows while price has already sliced through several intermediate supports. Below, the chart is stacked with closely packed levels that can slow a move, but not necessarily reverse it if sellers stay in control. Once a key range gives way, forced re-hedging and rule-based selling can accelerate the move, especially in a market already tired from months of underperformance versus BTC.
For traders, the read is straightforward. Until flows stabilize and spot products start printing steady inflows again, bounces into overhead resistance on both BTC and ETH are more likely to be used for de-risking than for fresh breakouts. The playbook now is to map your levels in advance, size positions for sustained volatility, and let flow and funding data confirm whether this is a buyable reset in an ongoing cycle or the opening phase of a deeper structural bleed.