BlockVizBlockViz
Price
Market Cap
Portfolio
Simulators
Resources
Pricing

Price

  • KPI Tracker
  • Techn. Analysis Chart
  • Indexed Comparison
  • Asset Risk Analyzer
  • Best & Worst Days
  • Seasonality Heatmap

Market Cap

  • Dominance
  • Development
  • Treemap

Portfolio

  • Tracker
  • Development
  • Comparison
  • Risk Analyzer

Simulators

  • Market Cap Parity
  • HODL vs. DCA
  • Coin Flip
  • Sell and Buy Back
  • Stop Loss
  • Portfolio Rebalance

Resources

  • Coins
  • Guides
  • Wiki
  • Blog
  • News

Community

X.comCMCBinanceYouTubeLinkedInDiscord

Product

PricingRewardsPartnersAll Tools

Resources

CoinsGuidesWikiNews

Company

AboutContactSupportLegal

Data provided by

CoinGecko

© 2026 BlockViz.xyz
All rights reserved.

Home
›News

Latest News

Home
›News
›Bitcoin Edges Toward 70K – A Buy or Sell Moment?
Bitcoin Edges Toward 70K – A Buy or Sell Moment?

Bitcoin Edges Toward 70K – A Buy or Sell Moment?

February 20, 2026|By BlockViz Insights
BTC

Bitcoin trades around $67k today, up ~1% from yesterday after probing $62,000 lows earlier this month. This places $BTC still 30% off its 2026 peak near $96,500, a correction tied to paused Fed rate cuts and a firm dollar index at 108. Trading volume remains subdued at $45 billion daily, down 40% from January peaks.

Macro factors weigh heavy. Elevated U.S. rates above 4.5% crimp liquidity for risk assets, with BTC's beta of 1.8 amplifying equity market pullbacks. Geopolitical tensions and softening global PMIs add caution, pushing the Crypto Fear & Greed Index to extreme fear at 22. Yet ETF net outflows eased to $250 million last week, the slowest in months.

On-chain metrics tell a bullish undercurrent story. Long-term holders added 15,000 BTC last week, per Glassnode data, while exchange reserves drop to 2.4 million coins, hinting at reduced selling pressure. Whale wallets above 1,000 BTC grew 2% month-over-month, framing BTC as a portfolio hedge amid fiat debasement fears.

History often favored buyers here. Post-2022's fear troughs below 20, BTC rallied 300% within six months on average. Institutions like MicroStrategy continue stacking, with total corporate holdings now over 450,000 BTC. A Fed pivot to 25bps cuts by mid-year could unlock $120,000 targets, aligning with halving cycle patterns. But will this be enough to break 4 year psychology? And if Iran gets attacked by the US all bets are off anyway... So remain cautious.

Key levels: $66k support holds firm; $72k resistance eyes breakout. Volatility suits patient accumulators over leveraged traders. Stay positioned, watch the data.
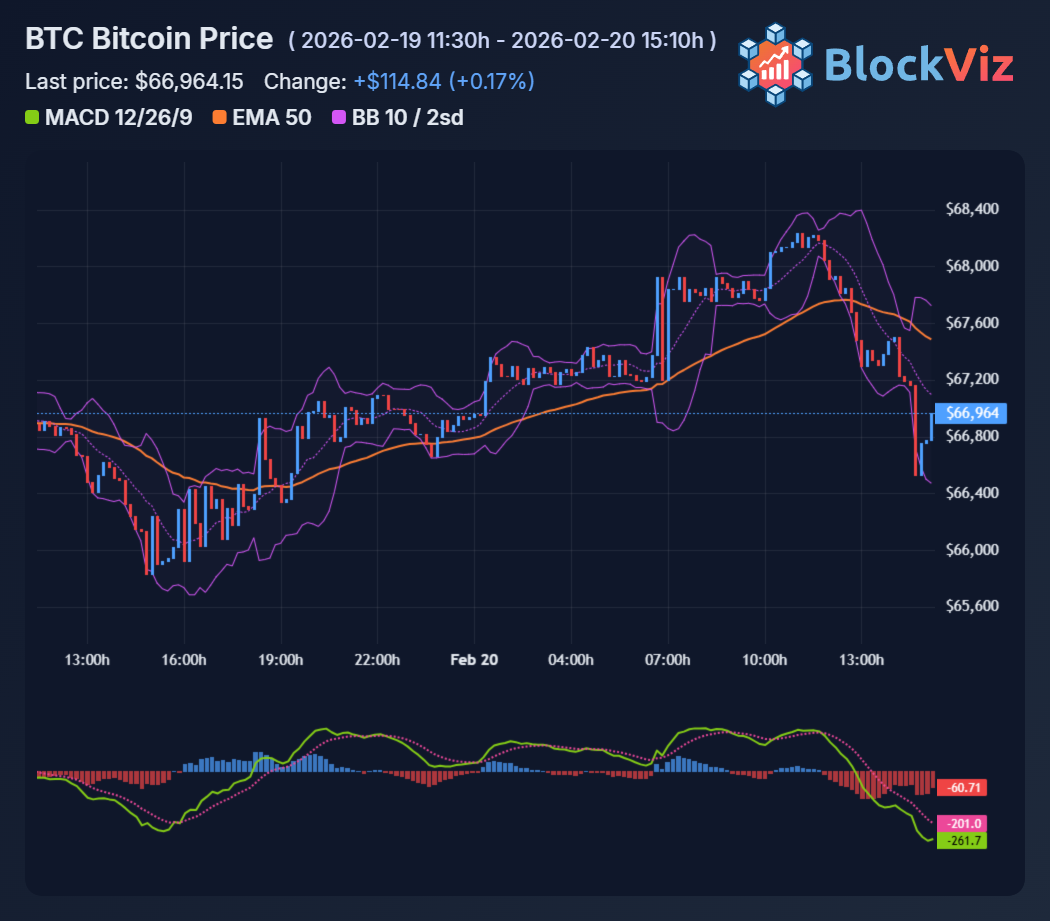
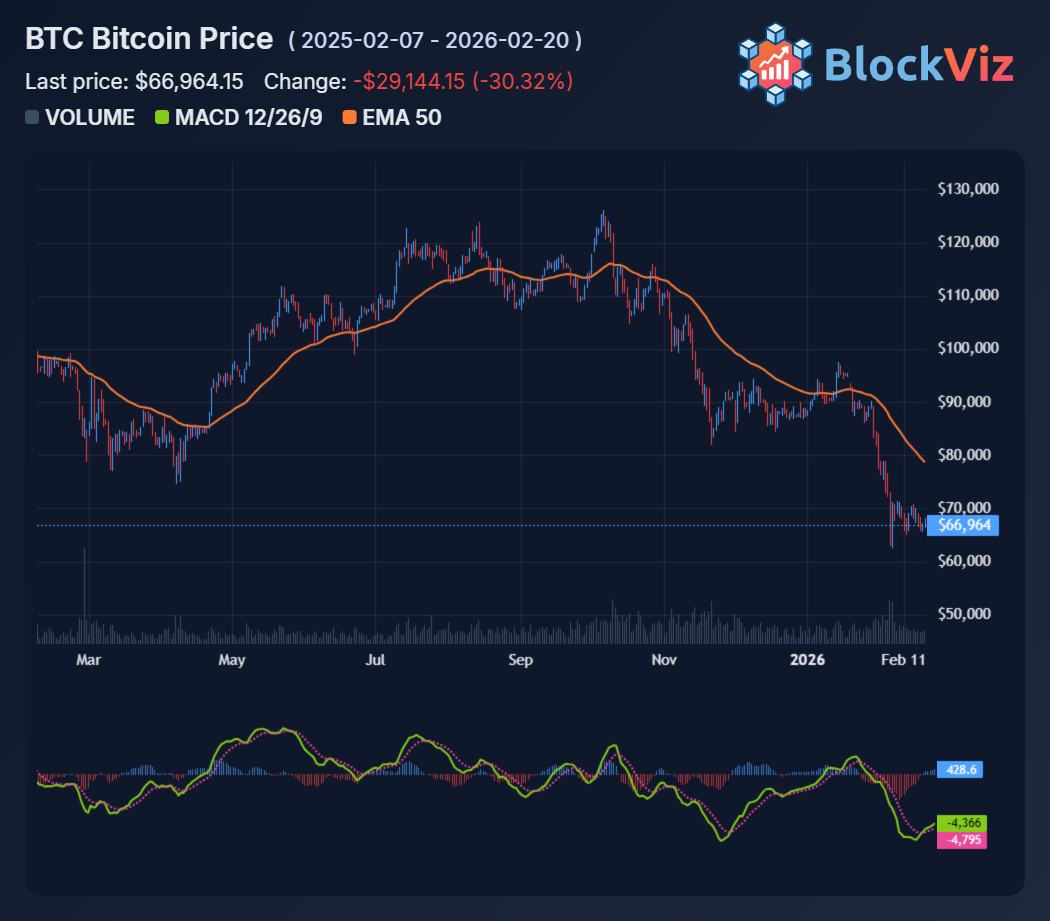
Technical Analysis Chart preview

Explore this related tool

Technical Analysis Chart

Use the interactive tool to explore the same concept with your own time range and settings.

Related Tool
Technical Analysis Chart

Technical Analysis Chart

Open Tool →

More News
Vitalik dumps more ETH - as it goes below 2k

Vitalik dumps more ETH - as it goes below 2k

Feb 23, 2026
Ethereum's Long Dominance Slide: From 30% Peak to sub-10% today

Ethereum's Long Dominance Slide: From 30% Peak to sub-10% today

Feb 21, 2026
BTC, ETH and XRP Sell Off While SOL Stays Green

BTC, ETH and XRP Sell Off While SOL Stays Green

Feb 19, 2026
Biggest Outflows Since 2022 – Will BTC and ETH Hold the Line?

Biggest Outflows Since 2022 – Will BTC and ETH Hold the Line?

Feb 18, 2026