BlockVizBlockViz
Price
Market Cap
Portfolio
Simulators
Resources
Pricing

Price

  • KPI Tracker
  • Techn. Analysis Chart
  • Indexed Comparison
  • Asset Risk Analyzer
  • Best & Worst Days
  • Seasonality Heatmap

Market Cap

  • Dominance
  • Development
  • Treemap

Portfolio

  • Tracker
  • Development
  • Comparison
  • Risk Analyzer

Simulators

  • Market Cap Parity
  • HODL vs. DCA
  • Coin Flip
  • Sell and Buy Back
  • Stop Loss
  • Portfolio Rebalance

Resources

  • Coins
  • Guides
  • Wiki
  • Blog
  • News

Community

X.comCMCBinanceYouTubeLinkedInDiscord

Product

PricingRewardsPartnersAll Tools

Resources

CoinsGuidesWikiNews

Company

AboutContactSupportLegal

Data provided by

CoinGecko

© 2026 BlockViz.xyz
All rights reserved.

Home
›News

Latest News

Home
›News
›Bitcoin’s Worst Q1 in 8 Years: Deleveraging or Cycle Reset?
Bitcoin’s Worst Q1 in 8 Years: Deleveraging or Cycle Reset?

Bitcoin’s Worst Q1 in 8 Years: Deleveraging or Cycle Reset?

February 16, 2026|By BlockViz Insights
BTC

Bitcoin down 22% year-to-date marks its weakest Q1 since 2018. Consecutive red months loom, but positioning signals a tactical reset, not trend break. Here’s the tradeable read.

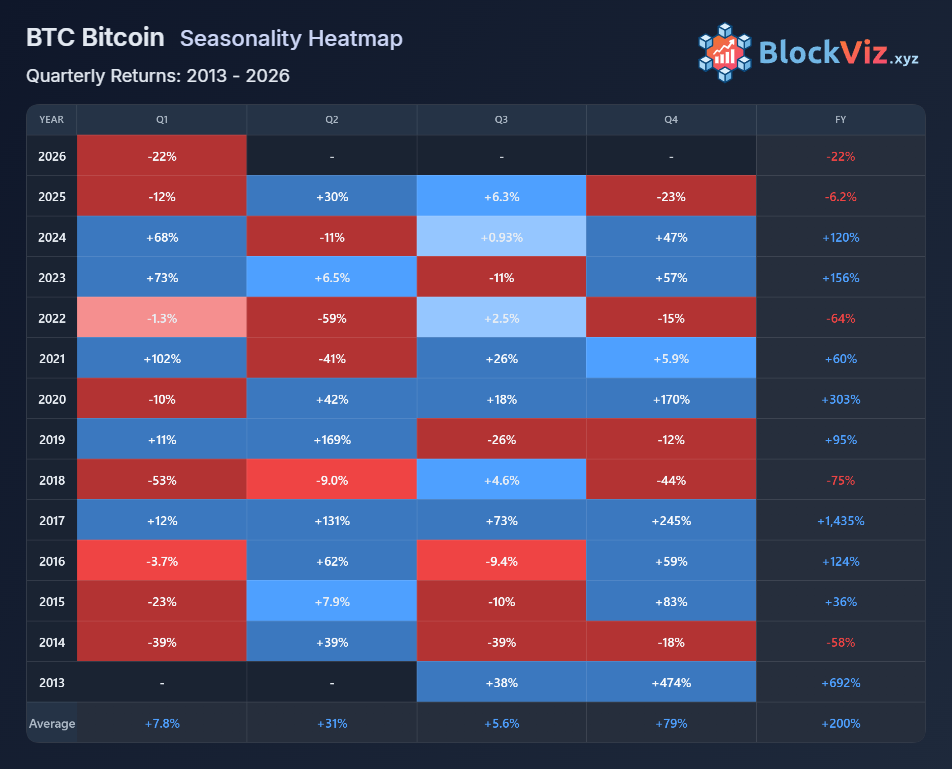
$BTC shed 22% through mid-February, rivaling the brutal Q1s of 2014, 2015 and 2018. Those were structural ruptures: retail euphoria collapsed into thin liquidity with no bid. This drawdown reads cleaner.


Orderly deleveraging dominates. Futures open interest dropped over 20% alongside price, a textbook risk-off repositioning without liquidation cascades. Leverage compression, not panic, sets the tone.

Spot dynamics evolved too. US ETFs now anchor demand, providing a floor absent in prior cycles. Flows may pause in risk-off but reaccelerate into supply squeezes like halvings. That maturity caps downside even as it mutes upside velocity.


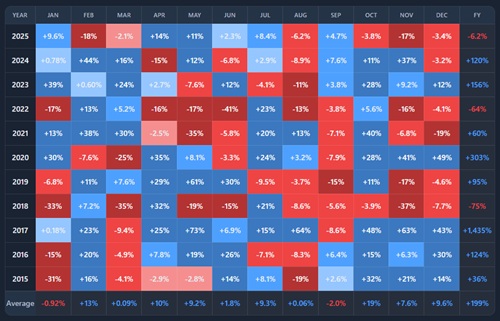
Seasonality adds context. Q1 ranks among Bitcoin’s roughest quarters, but weak starts often seed sharp Q2 rebounds. Back-to-back January-February losses would be a first, yet history shows no year defined by early pain alone.

Trader Playbook

• Size for volatility, not direction: quarter-end tests key structure post-20% drawdown.

• Prioritize flows over price: stabilizing ETF inflows plus flat leverage signal bottoms.

• Buy discomfort: cycle lows rebuild when specs de-risk, not when euphoria peaks.

This is positioning season. Patience compounds.

Seasonality Heatmap preview

Explore this related tool

Seasonality Heatmap

Use the interactive tool to explore the same concept with your own time range and settings.

Related Tool
Seasonality Heatmap

Seasonality Heatmap

Open Tool →

More News
Biggest Outflows Since 2022 – Will BTC and ETH Hold the Line?

Biggest Outflows Since 2022 – Will BTC and ETH Hold the Line?

Feb 18, 2026
CryptoQuant Data Hints At “Extreme Bear” – Optimal Entry?

CryptoQuant Data Hints At “Extreme Bear” – Optimal Entry?

Feb 17, 2026
Extreme Fear Drags BTC Down: Weekly Close Under 60K or Above 70K?

Extreme Fear Drags BTC Down: Weekly Close Under 60K or Above 70K?

Feb 13, 2026
ASTER Pumps Ahead of March Mainnet: Rally Sustainable?

ASTER Pumps Ahead of March Mainnet: Rally Sustainable?

Feb 12, 2026