BlockVizBlockViz
Price
Market Cap
Portfolio
Simulators
Resources
Pricing

Price

  • KPI Tracker
  • Techn. Analysis Chart
  • Indexed Comparison
  • Asset Risk Analyzer
  • Best & Worst Days
  • Seasonality Heatmap

Market Cap

  • Dominance
  • Development
  • Treemap

Portfolio

  • Tracker
  • Development
  • Comparison
  • Risk Analyzer

Simulators

  • Market Cap Parity
  • HODL vs. DCA
  • Coin Flip
  • Sell and Buy Back
  • Stop Loss
  • Portfolio Rebalance

Resources

  • Coins
  • Guides
  • Wiki
  • Blog
  • News

Community

X.comCMCBinanceYouTubeLinkedInDiscord

Product

PricingRewardsPartnersAll Tools

Resources

CoinsGuidesWikiNews

Company

AboutContactSupportLegal

Data provided by

CoinGecko

© 2026 BlockViz.xyz
All rights reserved.

Home
›News

Latest News

Home
›News
›Bitcoin Tests Key 60K Level as ETF Outflows Signal Fading Institutional Demand
Bitcoin Tests Key 60K Level as ETF Outflows Signal Fading Institutional Demand

Bitcoin Tests Key 60K Level as ETF Outflows Signal Fading Institutional Demand

June 29, 2026|By BlockViz Insights
BTC

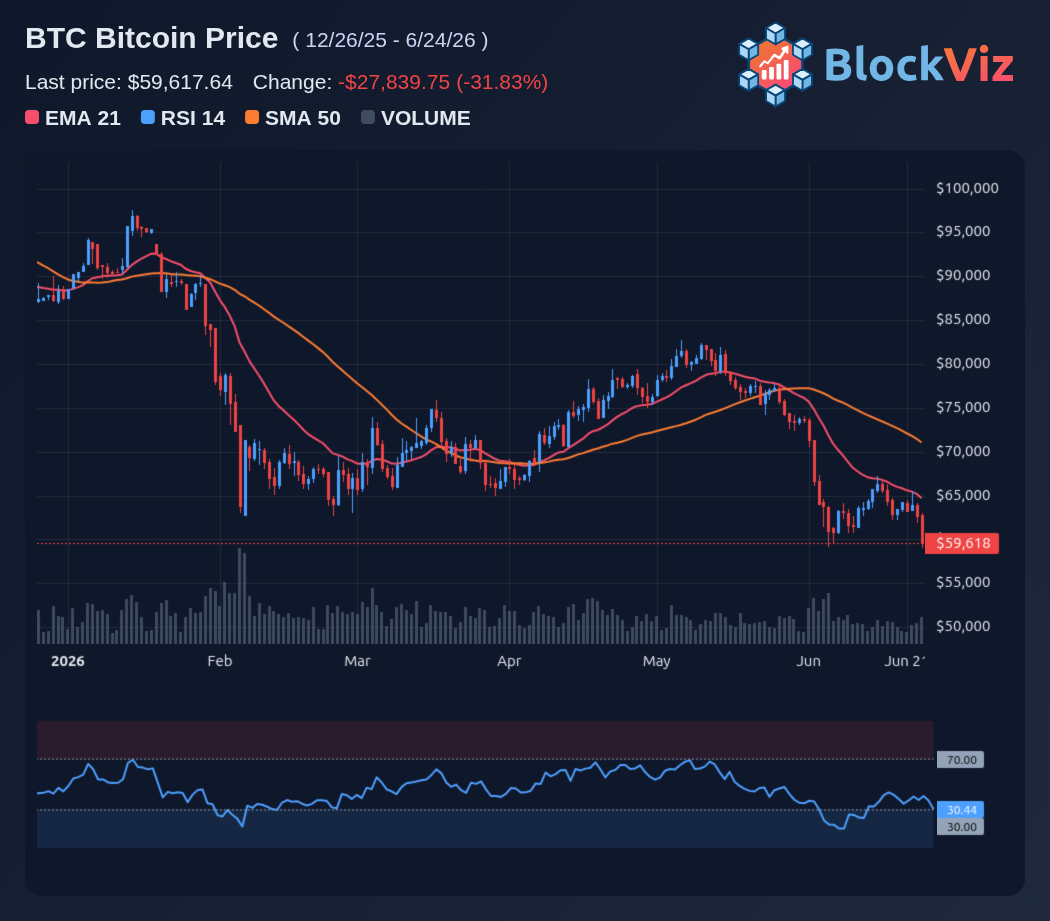
Seven straight weeks of ETF outflows is not noise anymore. It is a message: the easy bid has stepped back, and BTC is now trading like a market that has to prove demand, not assume it.

That is why the 60K zone matters so much. Above it, price can still frame this as a brutal reset and base-building phase. Losing it, and the market starts pricing in a deeper flush where weak hands get forced out and the next real support has to do the heavy lifting.

What makes this tape tricky is that ETF flows are still the cleanest read on institutional appetite, and they have been red long enough to drag on momentum. When that kind of persistent selling lines up with a crowded long setup, rebounds can be sharp but unstable. The first bounce is usually the one that traps the most people.

Market participants should observe three key indicators: whether daily ETF flows can sustain positive readings for more than one session, if BTC can hold 60K on a closing basis, and if any rejection leads to a swift move back into the prior range. Should flows cease to bleed and price reclaim lost ground, a squeeze would be initiated. Otherwise, the market would continue its search for genuine demand.
Technical Analysis Chart preview

Explore this related tool

Technical Analysis Chart

Use the interactive tool to explore the same concept with your own time range and settings.

Related Tool
Technical Analysis Chart

Technical Analysis Chart

Open Tool →

More News
How Trump's Crypto Empire Generated Over $1B Without Trading

How Trump's Crypto Empire Generated Over $1B Without Trading

Jul 1, 2026
Bitcoin Shorts Surge as Derivatives Lean Bearish Toward 55K Zone

Bitcoin Shorts Surge as Derivatives Lean Bearish Toward 55K Zone

Jun 30, 2026
Bitcoin Hovers Between 57K Support and 54K Breakdown Zone

Bitcoin Hovers Between 57K Support and 54K Breakdown Zone

Jun 28, 2026
Bitcoin Slips Below Key Long-Term EMA as Pressure Builds Toward 60K

Bitcoin Slips Below Key Long-Term EMA as Pressure Builds Toward 60K

Jun 9, 2026