
BlockVizBlockViz
Price
Market Cap
Portfolio
Simulators
Resources
Pricing

Price

  • KPI Tracker
  • Techn. Analysis Chart
  • Indexed Comparison
  • Asset Risk Analyzer
  • Best & Worst Days
  • Seasonality Heatmap

Market Cap

  • Dominance
  • Development
  • Treemap

Portfolio

  • Tracker
  • Development
  • Comparison
  • Risk Analyzer

Simulators

  • Market Cap Parity
  • HODL vs. DCA
  • Coin Flip
  • Sell and Buy Back
  • Stop Loss
  • Portfolio Rebalance

Resources

  • Coins
  • Guides
  • Wiki
  • Blog
  • News

Community

X.comCMCBinanceYouTubeLinkedInDiscord

Product

PricingRewardsPartnersAll Tools

Resources

CoinsGuidesWikiNews

Company

AboutContactSupportLegal

Data provided by

CoinGecko

© 2026 BlockViz.xyz
All rights reserved.

Home
›News

Latest News

Home
›News
›Bitcoin Slips Below Key Long-Term EMA as Pressure Builds Toward 60K
Bitcoin Slips Below Key Long-Term EMA as Pressure Builds Toward 60K

Bitcoin Slips Below Key Long-Term EMA as Pressure Builds Toward 60K

June 9, 2026|By BlockViz Insights
BTC

Bitcoin losing the 50-month EMA is not just a technical blemish; it is a regime check. That line has been a long-term trend compass through multiple cycles, and slipping below it shifts the conversation from "pullback" to "trend under pressure." The market now has to prove it can reclaim that level, not just bounce around it.

Why it matters now: this break comes with thinning spot demand and a derivatives market that's been leaning long. When a widely watched monthly level gives way, positioning can unwind fast. If bids don't step in quickly, what follows is usually a search for deeper liquidity, not a neat V-shaped recovery.

The obvious magnet is the 60K zone. It's psychological, it's where prior consolidation built volume, and it's where sidelined buyers may test conviction. Lose that cleanly and the chart opens toward the mid-$50s where the next meaningful support cluster sits from earlier accumulation.

Market participants will be closely observing whether a monthly close back above the 50-month EMA signals that the break was merely a shakeout. Failing that, the reaction of price on any retest from below will be key. Weak reclaim attempts and rising open interest on down moves would confirm distribution, while strong spot-led buying and declining leverage would hint at a base forming.
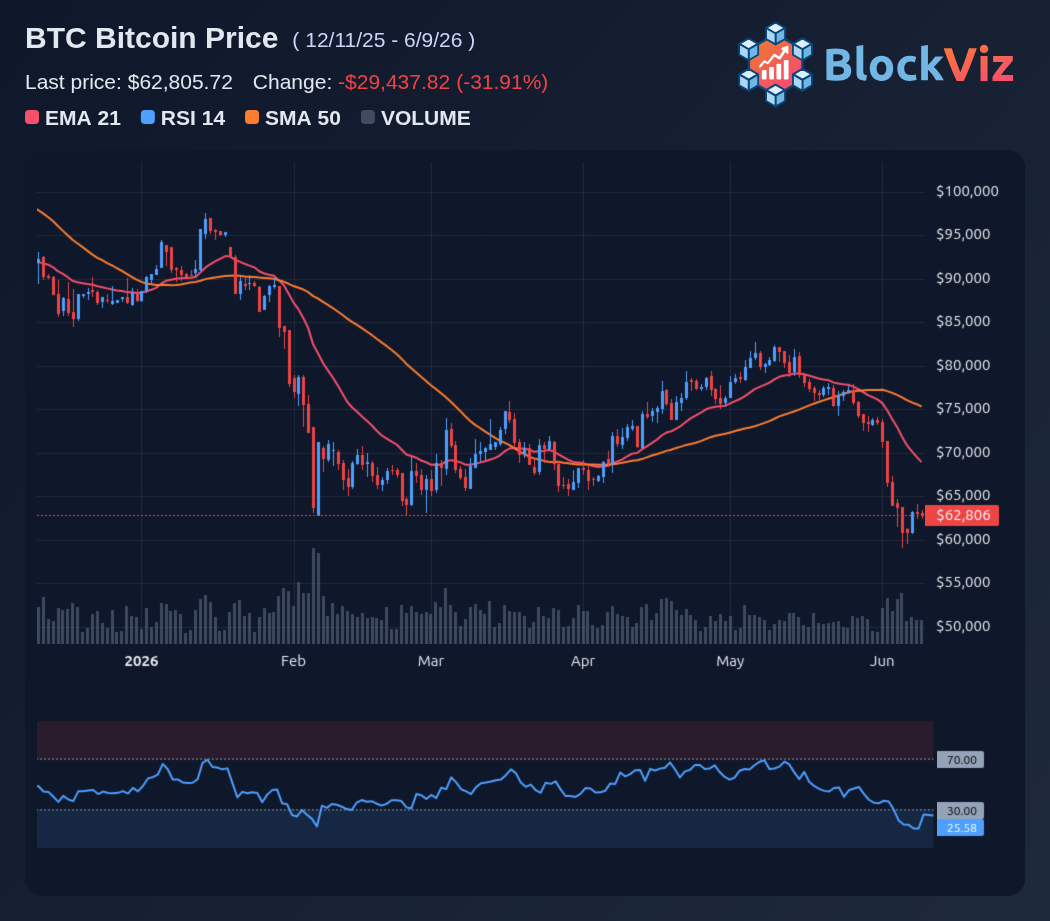
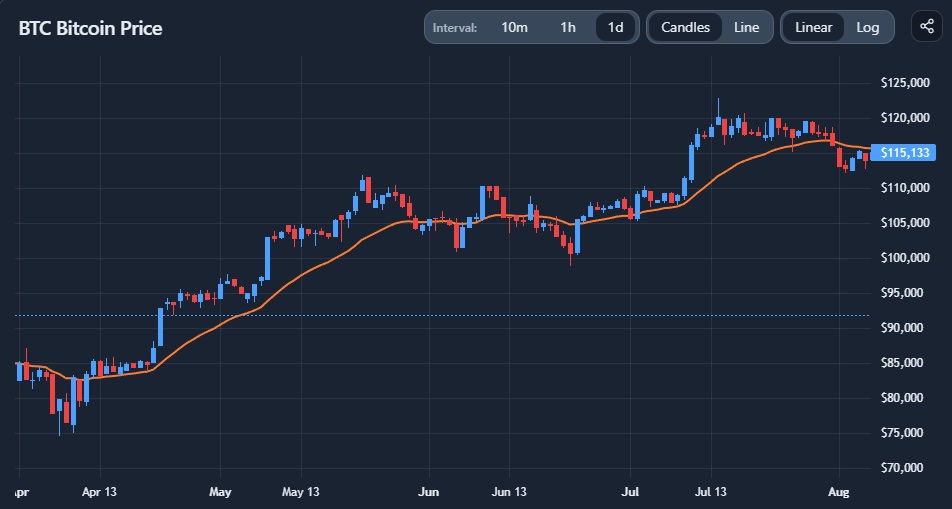
Technical Analysis Chart preview

Explore this related tool

Technical Analysis Chart

Use the interactive tool to explore the same concept with your own time range and settings.

Related Tool
Technical Analysis Chart

Technical Analysis Chart

Open Tool →

More News
Bitcoin Tests Key 60K Level as ETF Outflows Signal Fading Institutional Demand

Bitcoin Tests Key 60K Level as ETF Outflows Signal Fading Institutional Demand

Jun 29, 2026
Bitcoin Hovers Between 57K Support and 54K Breakdown Zone

Bitcoin Hovers Between 57K Support and 54K Breakdown Zone

Jun 28, 2026
Bitcoin's Drop to $60K Was a Leverage Flush, Not Saylor's Trade

Bitcoin's Drop to $60K Was a Leverage Flush, Not Saylor's Trade

Jun 8, 2026
AI Uncovers Long-Running Zcash Bug, Raising Fresh Questions on Supply Integrity

AI Uncovers Long-Running Zcash Bug, Raising Fresh Questions on Supply Integrity

Jun 5, 2026