
BlockVizBlockViz
Price
Market Cap
Portfolio
Simulators
Resources
Pricing

Price

  • KPI Tracker
  • Techn. Analysis Chart
  • Indexed Comparison
  • Asset Risk Analyzer
  • Best & Worst Days
  • Seasonality Heatmap

Market Cap

  • Dominance
  • Development
  • Treemap

Portfolio

  • Tracker
  • Development
  • Comparison
  • Risk Analyzer

Simulators

  • Market Cap Parity
  • HODL vs. DCA
  • Coin Flip
  • Sell and Buy Back
  • Stop Loss
  • Portfolio Rebalance

Resources

  • Coins
  • Guides
  • Wiki
  • Blog
  • News

Community

X.comCMCBinanceYouTubeLinkedInDiscord

Product

PricingRewardsPartnersAll Tools

Resources

CoinsGuidesWikiNews

Company

AboutContactSupportLegal

Data provided by

CoinGecko

© 2026 BlockViz.xyz
All rights reserved.

Home
›News

Latest News

Home
›News
›Bitcoin Shorts Surge as Derivatives Lean Bearish Toward 55K Zone
Bitcoin Shorts Surge as Derivatives Lean Bearish Toward 55K Zone

Bitcoin Shorts Surge as Derivatives Lean Bearish Toward 55K Zone

June 30, 2026|By BlockViz Insights
BTC

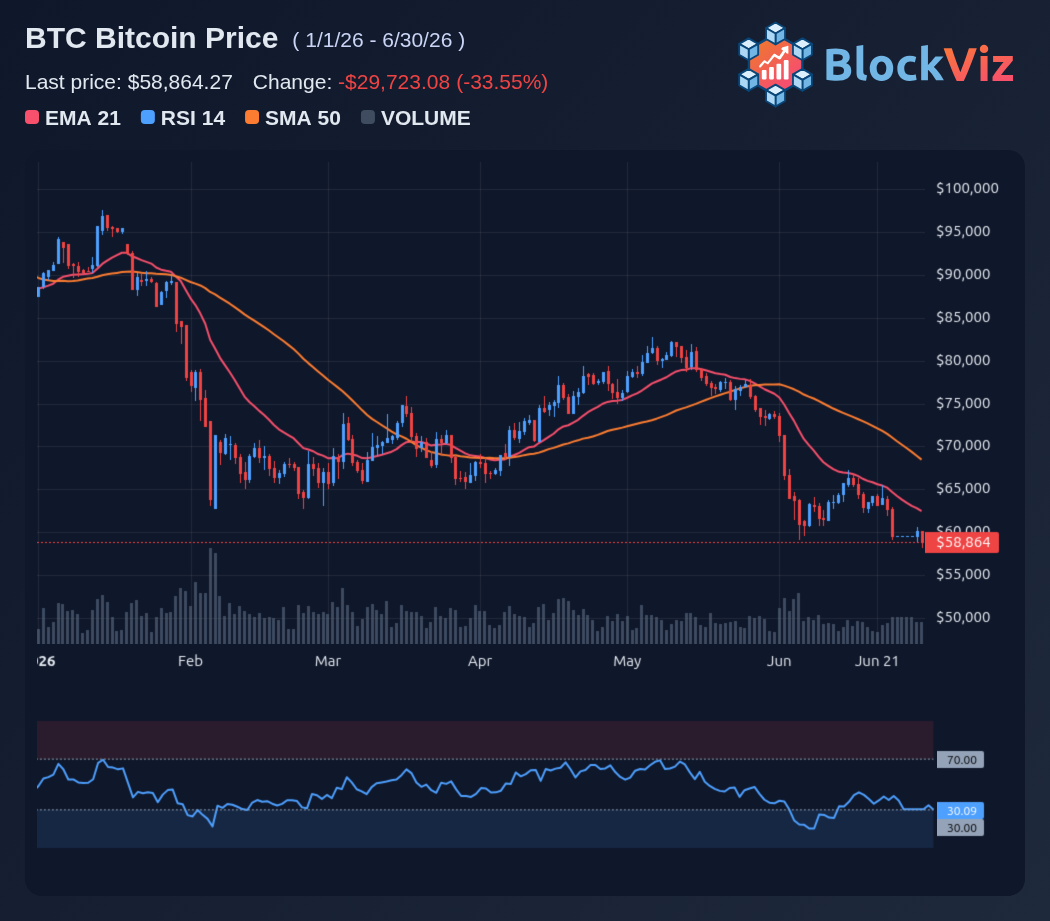
Bets against Bitcoin just spiked 7x, and that kind of crowding on the short side rarely shows up without a catalyst in mind. The market is clearly leaning into a downside narrative, with 55K becoming the magnet everyone is talking about. When positioning gets this one-sided, it matters less what people think and more how they're positioned to react.

The shift is visible across derivatives. Open interest has been climbing while funding tilts negative, a sign that shorts are pressing with leverage rather than spot sellers quietly distributing. Options flows are also skewing toward downside protection, with puts clustered below current price and implied volatility ticking higher on the left tail. This is not passive hedging; it is active bearish conviction.

The 55K level is not random. It lines up with prior consolidation and a high-liquidity zone where late longs would likely get squeezed out. If price starts accepting below the mid-$60K area, the path there opens quickly. But crowded trades come with a catch. If spot demand absorbs this pressure and price holds above key support, those same shorts can become fuel for a sharp move up.

Market participants should observe whether spot confirms the derivatives story. Key indicators include sustained negative funding without corresponding price follow-through, which would suggest absorption. Additionally, monitoring ETF flows and whether dip buyers step in around high-volume nodes will be important. If price reclaims momentum while shorts are still piling in, the unwind could be fast. If not, the market may test the extent of demand near 55K.
Technical Analysis Chart preview

Explore this related tool

Technical Analysis Chart

Use the interactive tool to explore the same concept with your own time range and settings.

Related Tool
Technical Analysis Chart

Technical Analysis Chart

Open Tool →

More News
How Trump's Crypto Empire Generated Over $1B Without Trading

How Trump's Crypto Empire Generated Over $1B Without Trading

Jul 1, 2026
Bitcoin Tests Key 60K Level as ETF Outflows Signal Fading Institutional Demand

Bitcoin Tests Key 60K Level as ETF Outflows Signal Fading Institutional Demand

Jun 29, 2026
Bitcoin Hovers Between 57K Support and 54K Breakdown Zone

Bitcoin Hovers Between 57K Support and 54K Breakdown Zone

Jun 28, 2026
Bitcoin Slips Below Key Long-Term EMA as Pressure Builds Toward 60K

Bitcoin Slips Below Key Long-Term EMA as Pressure Builds Toward 60K

Jun 9, 2026