BlockVizBlockViz
Price
Market Cap
Portfolio
Simulators
Resources
Pricing

Price

  • KPI Tracker
  • Techn. Analysis Chart
  • Indexed Comparison
  • Asset Risk Analyzer
  • Best & Worst Days
  • Seasonality Heatmap

Market Cap

  • Dominance
  • Development
  • Treemap

Portfolio

  • Tracker
  • Development
  • Comparison
  • Risk Analyzer

Simulators

  • Market Cap Parity
  • HODL vs. DCA
  • Coin Flip
  • Sell and Buy Back
  • Stop Loss
  • Portfolio Rebalance

Resources

  • Coins
  • Guides
  • Wiki
  • Blog
  • News

Community

X.comCMCBinanceYouTubeLinkedInDiscord

Product

PricingRewardsPartnersAll Tools

Resources

CoinsGuidesWikiNews

Company

AboutContactSupportLegal

Data provided by

CoinGecko

© 2026 BlockViz.xyz
All rights reserved.

Home
›News

Latest News

Home
›News
›Bitcoin's Drop to $60K Was a Leverage Flush, Not Saylor's Trade
Bitcoin's Drop to $60K Was a Leverage Flush, Not Saylor's Trade

Bitcoin's Drop to $60K Was a Leverage Flush, Not Saylor's Trade

June 8, 2026|By BlockViz Insights
BTC

“Saylor sold 32 BTC then bought 1550” is a great headline, but it is not the reason Bitcoin kissed 60K. That tiny sale is noise next to the scale of what actually moves this market. The real story is positioning and liquidity, not a single corporate wallet trim.

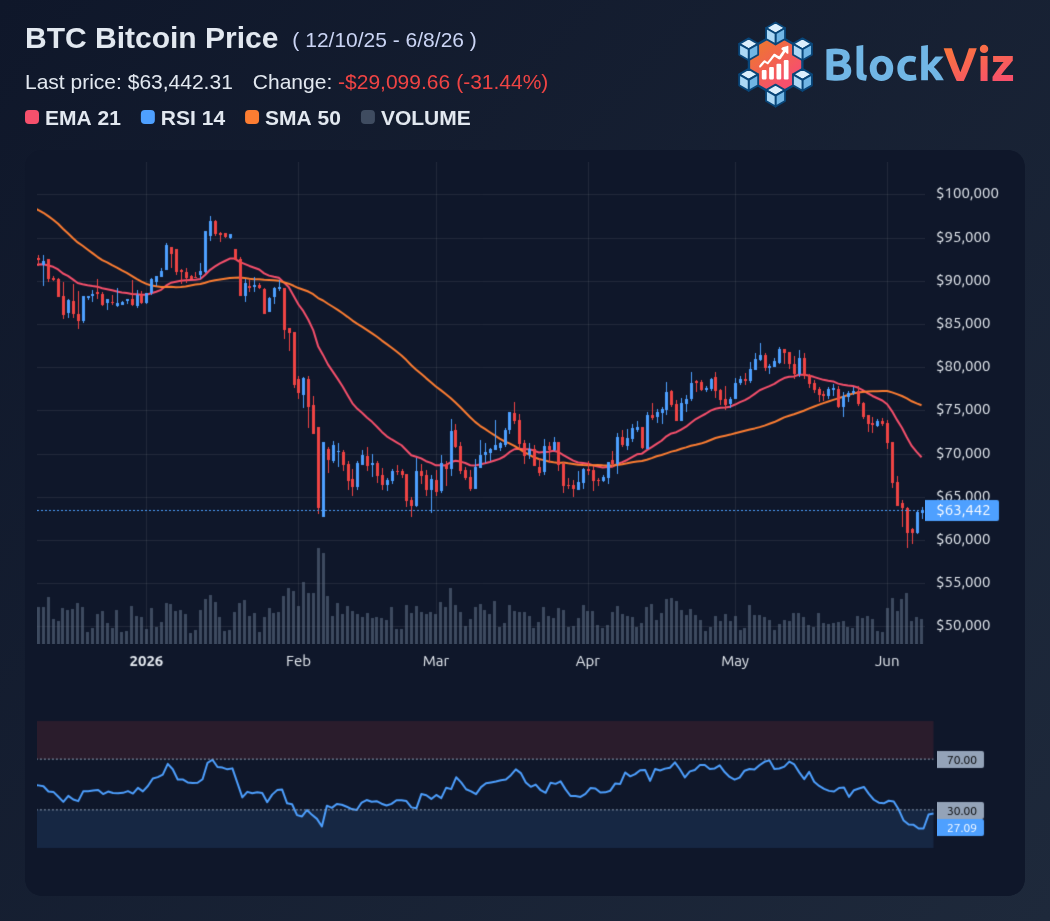
The drop into 60K had the fingerprints of leverage getting flushed. Open interest was elevated, funding had been leaning long, and bids were thinner than they looked. When price slipped, it triggered a chain of liquidations and forced sellers, pushing BTC into the nearest liquidity pocket. That is how you get fast, mechanical downside without a headline catalyst.

Meanwhile, Saylor's net action is still aggressively bullish. Selling 32 and adding 1550 is not distribution; it is accumulation with treasury management around it. What matters is the ongoing absorption of supply by large balance sheets versus the short-term traders who get squeezed out on every volatility spike.

So who “crashed” Bitcoin? Overleveraged longs, market makers hunting liquidity, and a market that got ahead of itself. Not a 32 BTC sale.

Key observations will include whether spot demand steps back in around the mid-$60K range, how funding resets, and if open interest rebuilds more cautiously. Should bids show up and volatility compresses, that 60K print would begin to appear more like a cleanup rather than a market top. Otherwise, the next test would be how deep the market needs to go to find genuine buyers.

Technical Analysis Chart preview

Explore this related tool

Technical Analysis Chart

Use the interactive tool to explore the same concept with your own time range and settings.

Related Tool
Technical Analysis Chart

Technical Analysis Chart

Open Tool →

More News
AI Uncovers Long-Running Zcash Bug, Raising Fresh Questions on Supply Integrity

AI Uncovers Long-Running Zcash Bug, Raising Fresh Questions on Supply Integrity

Jun 5, 2026
Bitcoin Tests $60K After 50% Drop as Market Searches for a True Floor

Bitcoin Tests $60K After 50% Drop as Market Searches for a True Floor

Jun 4, 2026
Bearish Calls Grow Around 50K as Quiet Market Signals Hint at Reversal

Bearish Calls Grow Around 50K as Quiet Market Signals Hint at Reversal

Jun 3, 2026
Mt. Gox Shifts $739M in Bitcoin as BTC Slips Below $70K

Mt. Gox Shifts $739M in Bitcoin as BTC Slips Below $70K

Jun 2, 2026