BlockVizBlockViz
Price
Market Cap
Portfolio
Simulators
Resources
Pricing

Price

  • KPI Tracker
  • Techn. Analysis Chart
  • Indexed Comparison
  • Asset Risk Analyzer
  • Best & Worst Days
  • Seasonality Heatmap

Market Cap

  • Dominance
  • Development
  • Treemap

Portfolio

  • Tracker
  • Development
  • Comparison
  • Risk Analyzer

Simulators

  • Market Cap Parity
  • HODL vs. DCA
  • Coin Flip
  • Sell and Buy Back
  • Stop Loss
  • Portfolio Rebalance

Resources

  • Coins
  • Guides
  • Wiki
  • Blog
  • News

Community

X.comCMCBinanceYouTubeLinkedInDiscord

Product

PricingRewardsPartnersAll Tools

Resources

CoinsGuidesWikiNews

Company

AboutContactSupportLegal

Data provided by

CoinGecko

© 2026 BlockViz.xyz
All rights reserved.

Home
›News

Latest News

Home
›News
›Bitcoin Faces Familiar Post-FOMC Pressure as Key Support Zone Emerges
Bitcoin Faces Familiar Post-FOMC Pressure as Key Support Zone Emerges

Bitcoin Faces Familiar Post-FOMC Pressure as Key Support Zone Emerges

April 29, 2026|By BlockViz Insights
BTC

BTC doesn't need a surprise Fed move to dump. It just needs crowded positioning, and that's been enough for 8 of the last 9 FOMCs to flip into a sell-the-news event within 48 hours.

That's why this meeting matters so much. The setup keeps repeating: traders lean long into the decision, volatility compresses, then the first post-FOMC flush clears out weak hands fast. When BTC comes into the event extended, the unwind can be sharp even if Powell says exactly what everyone expected.

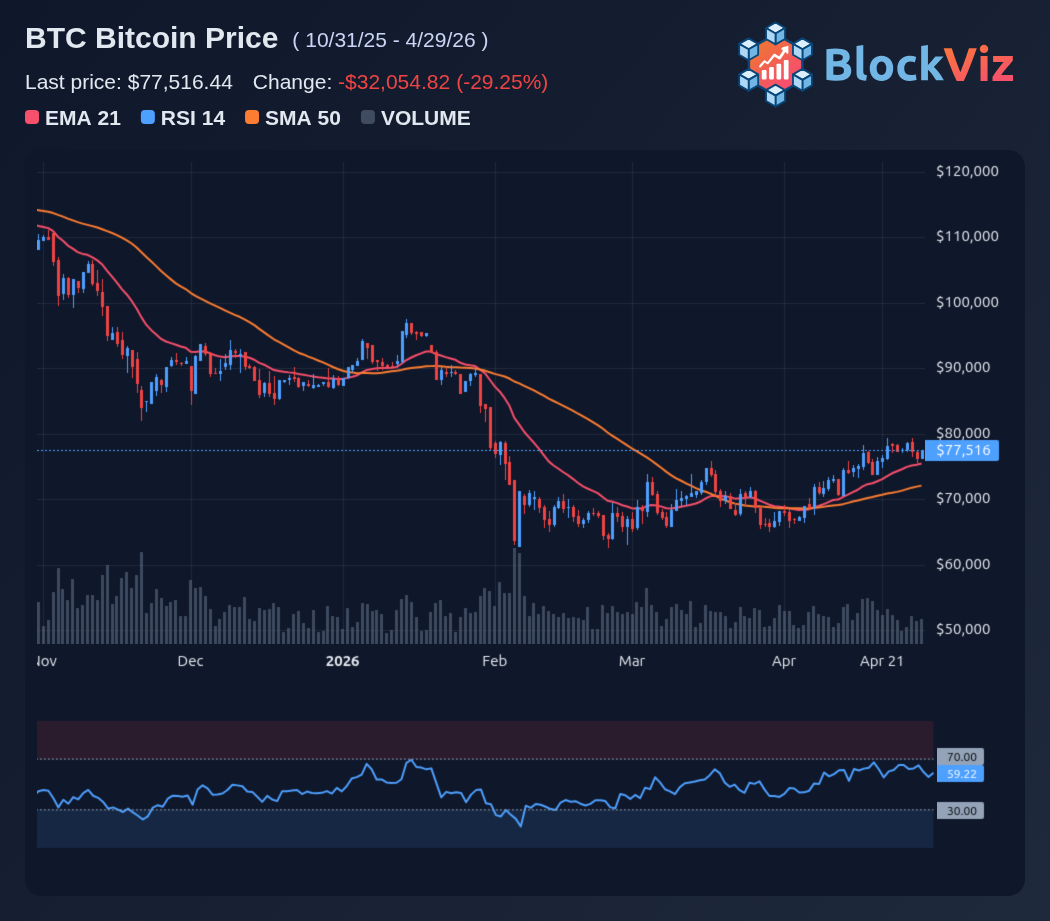
So what's the next price magnet? History points to the area where prior FOMC dumps usually exhaust. The recent pattern suggests a pullback into the mid-$70Ks, with the broader buyer zone sitting roughly in the $73,000 to $76,800 band if the 48-hour sell-the-news rhythm repeats again. If that zone breaks cleanly, the market likely starts pricing a deeper liquidity sweep instead of a quick shakeout.

The market's immediate focus will be on whether Bitcoin can hold the post-meeting dip, if ETF flow remains firm, and whether BTC reclaims the lost range quickly or continues to experience downward pressure. This dynamic often reflects whether the market has already priced in future expectations and is now reacting to current realities.

Technical Analysis Chart preview

Explore this related tool

Technical Analysis Chart

Use the interactive tool to explore the same concept with your own time range and settings.

Related Tool
Technical Analysis Chart

Technical Analysis Chart

Open Tool →

More News
Bitcoin Stalls Below 80K as Buyers Struggle to Overpower Persistent Sellers

Bitcoin Stalls Below 80K as Buyers Struggle to Overpower Persistent Sellers

May 1, 2026
Hyperliquid Targets Prediction Market Dominance as HYPE Gains Strategic Edge

Hyperliquid Targets Prediction Market Dominance as HYPE Gains Strategic Edge

Apr 30, 2026
MicroStrategy Buying Faster Than Bitcoin Is Mined: Is a Supply Squeeze Near?

MicroStrategy Buying Faster Than Bitcoin Is Mined: Is a Supply Squeeze Near?

Apr 28, 2026
Bitcoin Faces Renewed Fork Debate as eCash Proposal Tests Network Direction

Bitcoin Faces Renewed Fork Debate as eCash Proposal Tests Network Direction

Apr 27, 2026