BlockVizBlockViz
Price
Market Cap
Portfolio
Simulators
Resources
Pricing

Price

  • KPI Tracker
  • Techn. Analysis Chart
  • Indexed Comparison
  • Asset Risk Analyzer
  • Best & Worst Days
  • Seasonality Heatmap

Market Cap

  • Dominance
  • Development
  • Treemap

Portfolio

  • Tracker
  • Development
  • Comparison
  • Risk Analyzer

Simulators

  • Market Cap Parity
  • HODL vs. DCA
  • Coin Flip
  • Sell and Buy Back
  • Stop Loss
  • Portfolio Rebalance

Resources

  • Coins
  • Guides
  • Wiki
  • Blog
  • News

Community

X.comCMCBinanceYouTubeLinkedInDiscord

Product

PricingRewardsPartnersAll Tools

Resources

CoinsGuidesWikiNews

Company

AboutContactSupportLegal

Data provided by

CoinGecko

© 2026 BlockViz.xyz
All rights reserved.

Home
›News

Latest News

Home
›News
›ETF Inflows Offset Retail Selling as Bitcoin Eyes Key $80K Liquidity Zone
ETF Inflows Offset Retail Selling as Bitcoin Eyes Key $80K Liquidity Zone

ETF Inflows Offset Retail Selling as Bitcoin Eyes Key $80K Liquidity Zone

April 24, 2026|By BlockViz Insights
BTC

ETF money is still doing the heavy lifting while retail keeps fading the move, and that split matters because it tells you this is not a pure momentum squeeze. When the bid comes from funds and the sell pressure comes from impatient holders, price can grind higher even when sentiment feels wrong.

That's why $80K is the line everyone is staring at. It is not just a round number; it is the next real liquidity pocket, the kind of level where breakout buyers, trapped shorts, and late longs all collide at once.

The setup is simple: if ETF demand keeps absorbing supply, Bitcoin can keep pushing into that zone without needing a perfect headline. If flows cool off or weekend liquidity thins out, the market can easily fake strength and slip back into the range before it ever gets a clean shot at $80K.

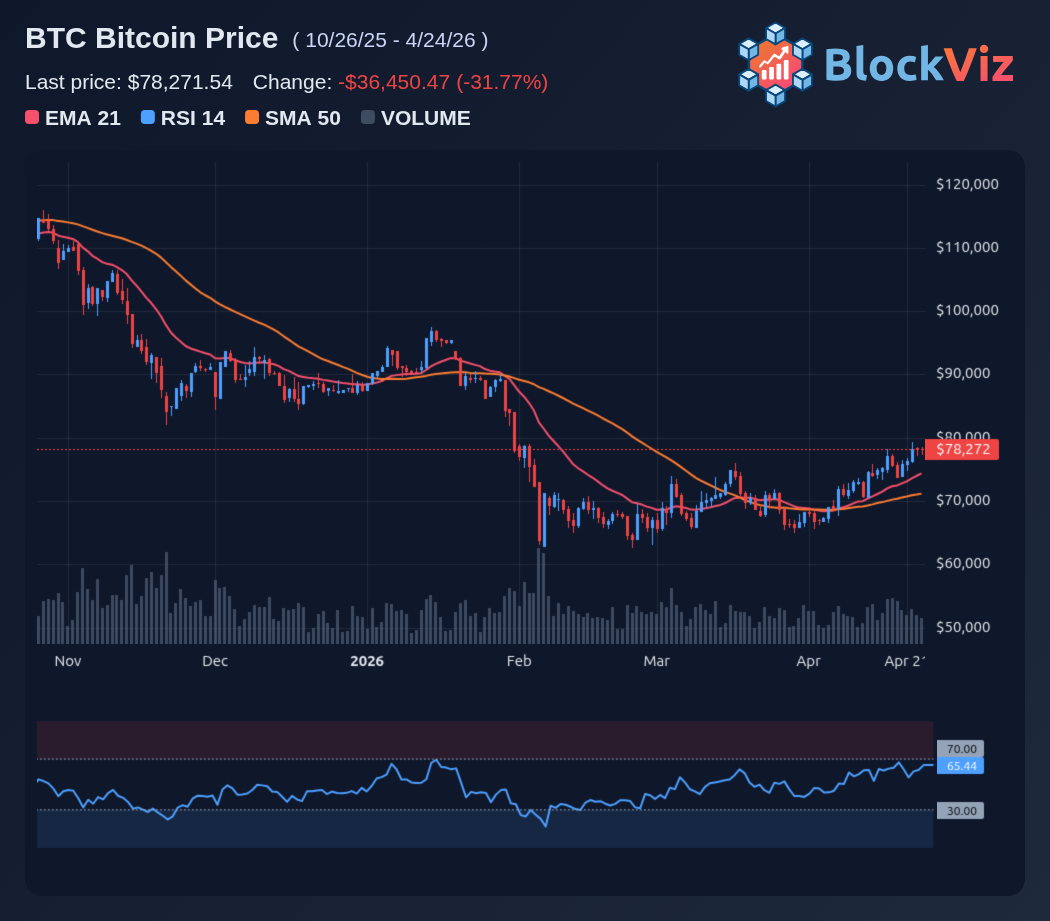
Market participants should observe whether spot demand remains firm into the close, if the $76K to $78K range acts as a launchpad rather than a ceiling, and if any move above that attracts significant volume instead of just noise.

Technical Analysis Chart preview

Explore this related tool

Technical Analysis Chart

Use the interactive tool to explore the same concept with your own time range and settings.

Related Tool
Technical Analysis Chart

Technical Analysis Chart

Open Tool →

More News
Justin Sun vs WLFI: Governance Clash Raises Billion-Dollar Questions

Justin Sun vs WLFI: Governance Clash Raises Billion-Dollar Questions

Apr 23, 2026
Whale Accumulation Near $1B Signals Rising Confidence in Bitcoin's Push Toward $80K

Whale Accumulation Near $1B Signals Rising Confidence in Bitcoin's Push Toward $80K

Apr 22, 2026
Institutional Bitcoin Accumulation Shrinks Tradable Supply

Institutional Bitcoin Accumulation Shrinks Tradable Supply

Apr 21, 2026
DeFi Market Loses $13B in 48 Hours as Aave Faces Post-Exploit Confidence Crisis

DeFi Market Loses $13B in 48 Hours as Aave Faces Post-Exploit Confidence Crisis

Apr 20, 2026