A whale just executed an $80 million long position on ETH using 20x leverage. This positions them for massive upside if Ethereum breaks higher. The notional exposure hits $1.6 billion. One wrong move, and liquidation looms large.
The Setup Breakdown
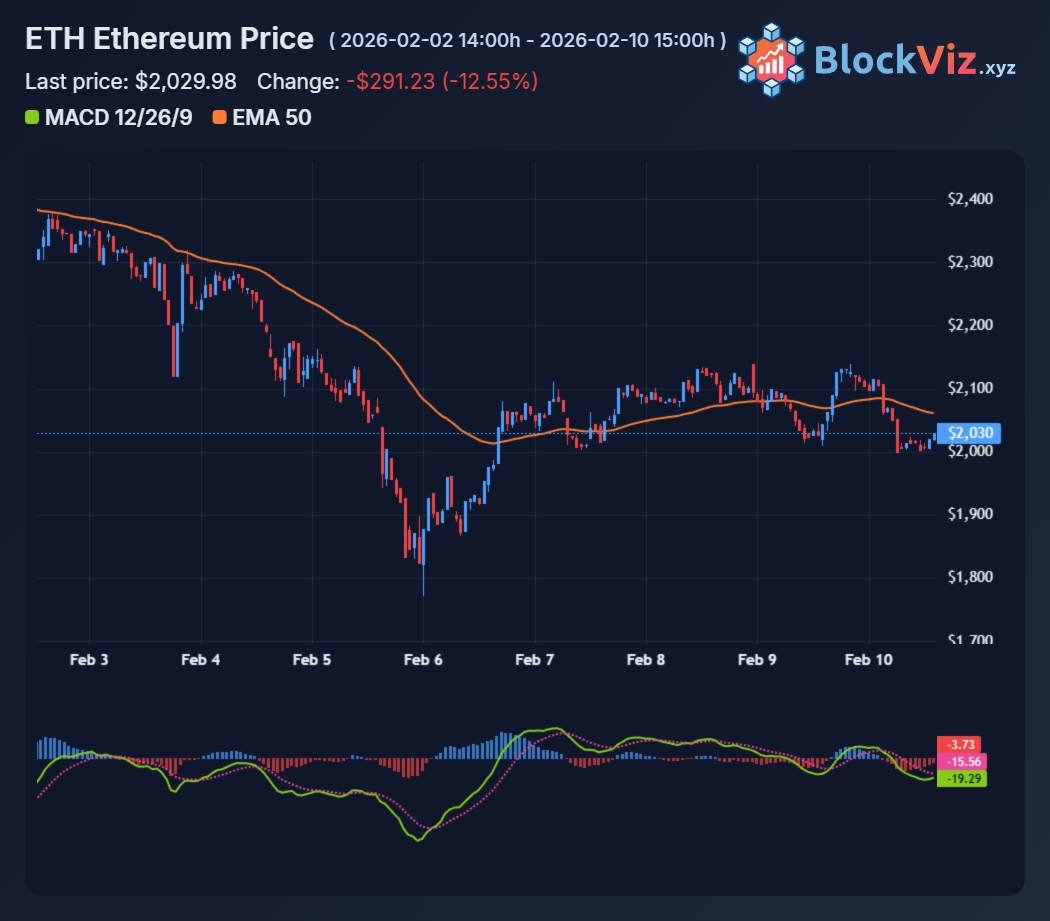
ETH hovers near critical support at recent lows. Bulls defend it fiercely. The whale's entry aligns with building order flow. It absorbs selling pressure and could flip sentiment bullish. Open interest rises, hinting at fresh capital inflow. But thin liquidity amplifies impact. A single push tests the depth of buy-side interest.
Why 20x Leverage? The Math
Leverage multiplies returns but devours margin on pullbacks. At 20x, a 5% ETH gain nets 100% on collateral. Turn $80M into $160M profit potential. Flip it: a 5% drop triggers full wipeout. Funding rates compound the pain. Positive rates favor shorts, charging longs hourly. In sideways chop, costs erode the edge fast. Whales thrive here only with precise timing and layered stops.
Market Forces at Play
ETH faces macro crosswinds. Spot ETF inflows could ignite a squeeze if they accelerate. Network upgrades boost utility, drawing staked ETH off exchanges. Counter risks: beta to Bitcoin drags it down on risk-off days. Rising open interest signals crowded trades. Watch for divergence between price and funding. Negative rates greenlight longs. Persistent positives scream caution.
Risk Management Lessons
This move spotlights discipline. Whales hedge with options or spot shorts. They ladder entries to average in. Trail stops behind structure. Monitor liquidation heatmaps for cascade risks. Backtest the thesis: does ETH momentum match historical whale signals?
The Point: Trade Like a Whale, Risk Like a Pro
Big bets drive markets but expose flaws. This $80M long tests ETH conviction amid uncertainty. Success hinges on momentum, not hope. Use it as a signal, but confirm with volume, rates, and levels. Avoid blind mirroring.