BlockVizBlockViz
Price
Market Cap
Portfolio
Simulators
Resources
Pricing

Price

  • KPI Tracker
  • Techn. Analysis Chart
  • Indexed Comparison
  • Asset Risk Analyzer
  • Best & Worst Days
  • Seasonality Heatmap

Market Cap

  • Dominance
  • Development
  • Treemap

Portfolio

  • Tracker
  • Development
  • Comparison
  • Risk Analyzer

Simulators

  • Market Cap Parity
  • HODL vs. DCA
  • Coin Flip
  • Sell and Buy Back
  • Stop Loss
  • Portfolio Rebalance

Resources

  • Coins
  • Guides
  • Wiki
  • Blog
  • News

Community

X.comCMCBinanceYouTubeLinkedInDiscord

Product

PricingRewardsPartnersAll Tools

Resources

CoinsGuidesWikiNews

Company

AboutContactSupportLegal

Data provided by

CoinGecko

© 2026 BlockViz.xyz
All rights reserved.

Home
›News

Latest News

Home
›News
›Strategy (MSTR) clarifies their breaking point BTC price
Strategy (MSTR) clarifies their breaking point BTC price

Strategy (MSTR) clarifies their breaking point BTC price

February 6, 2026|By BlockViz Insights
BTCSaylor

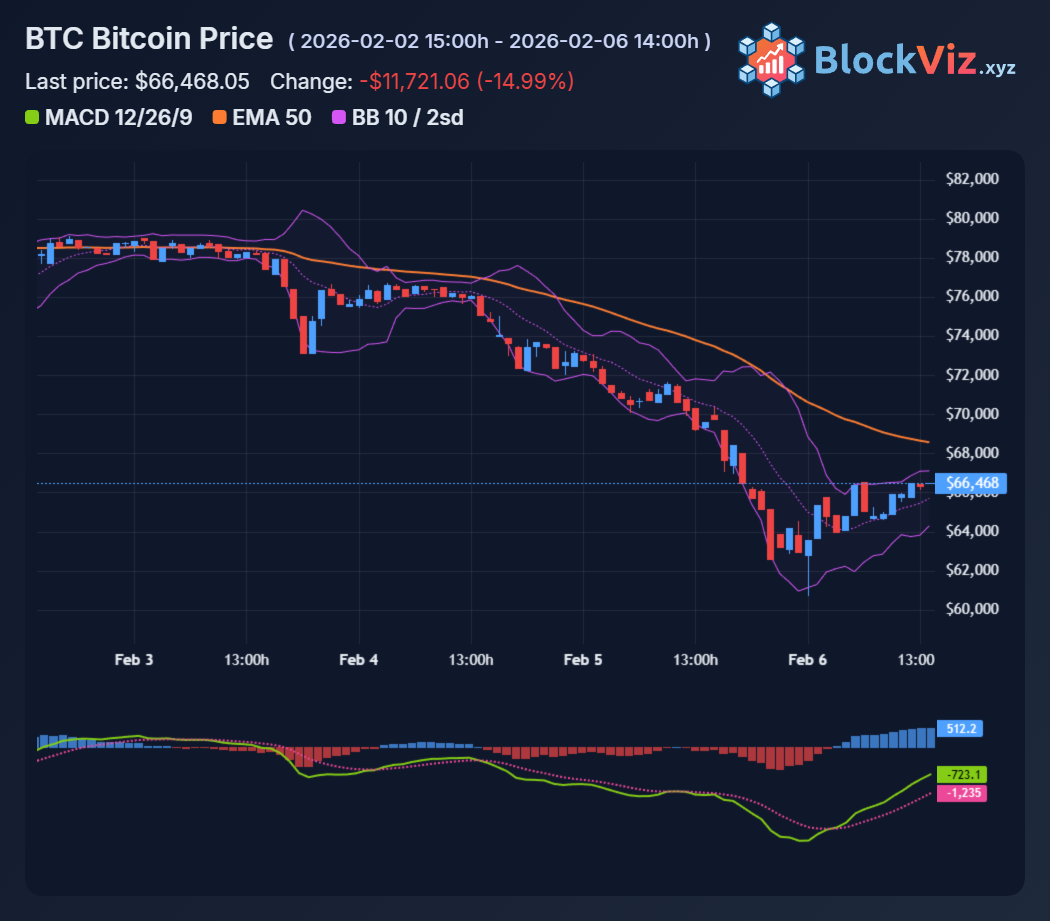
Saylor and CEO Phong Le held an investor call today addressing the panic: with BTC at ~$62K and MSTR down 52% from 2025 highs, is there a price where they finally sell Bitcoin? Answer: No breaking point, even at $8K.

Call Takeaways

• Saylor preached "infinite conviction"—Bitcoin is "digital capital" held for generations. No forced sell triggers: no mNAV covenant (0.9x now), no liquidity issues, no index deadlines. $2.25B cash covers debt through 2028 even if BTC hits zero. They just bought 1,287 BTC in Jan at $90K avg.

• Key Saylor quote: "If Bitcoin goes to $8K, we HODL harder. Balance sheet built for asymmetry—unlimited upside, finite downside." Q4's $12.4B unrealized loss? "Noise." Their 713,502 BTC (3% supply, $76K avg cost) is perfect positioning.

Stress Test at $8K

• Holdings: 713,502 BTC × $8K = $5.7B (vs $54B cost → 89% loss, $48B hit)

• Debt: $4.5B convertibles (2028+), 2x covered by cash. No margin calls.

• Software: $500M+ annual rev, profitable ex-BTC.

• NAV: Trades 20-25% below BTC NAV now; $8K widens it, but rebound closes gap.


2x levered via debt/equity, no recourse loans. Market cap tanks, dilution ramps via ATMs—but zero forced BTC sales.

Odds of $8K (87% Drawdown)

• Bear (25%): Macro crash (recession, Iran, ETF bleeds) → $15K adjusted 2022 lows, panic to $8K. MSTR buys more.

• Base (65%): Bottoms 65-70K on RSI oversold + halving dynamics.

• Bull (10%): $90K+ rebound on flows.


Hitting $8K? 15-20% odds in 2026. Needs 70K/65K/50K breaks in thin liquidity. Post-halving rarer than 2018/2022 85% crashes. MSTR survives.

Call kills "MSTR forces BTC lower" narrative. Built for $8K+. Watch ETF flows: green → $90K, red → 65K test.

Technical Analysis Chart preview

Explore this related tool

Technical Analysis Chart

Use the interactive tool to explore the same concept with your own time range and settings.

Related Tool
Technical Analysis Chart

Technical Analysis Chart

Open Tool →

More News
Whale Opens $80M ETH Long! Bullish?

Whale Opens $80M ETH Long! Bullish?

Feb 10, 2026
After crash: Binance, Strategy and BitMine Buy the Dip

After crash: Binance, Strategy and BitMine Buy the Dip

Feb 9, 2026
Bitcoin hits lowest RSI since 2022 bear market! Bottom in?

Bitcoin hits lowest RSI since 2022 bear market! Bottom in?

Feb 5, 2026
Ethereum abandons L2 Scaling - What's next?

Ethereum abandons L2 Scaling - What's next?

Feb 4, 2026