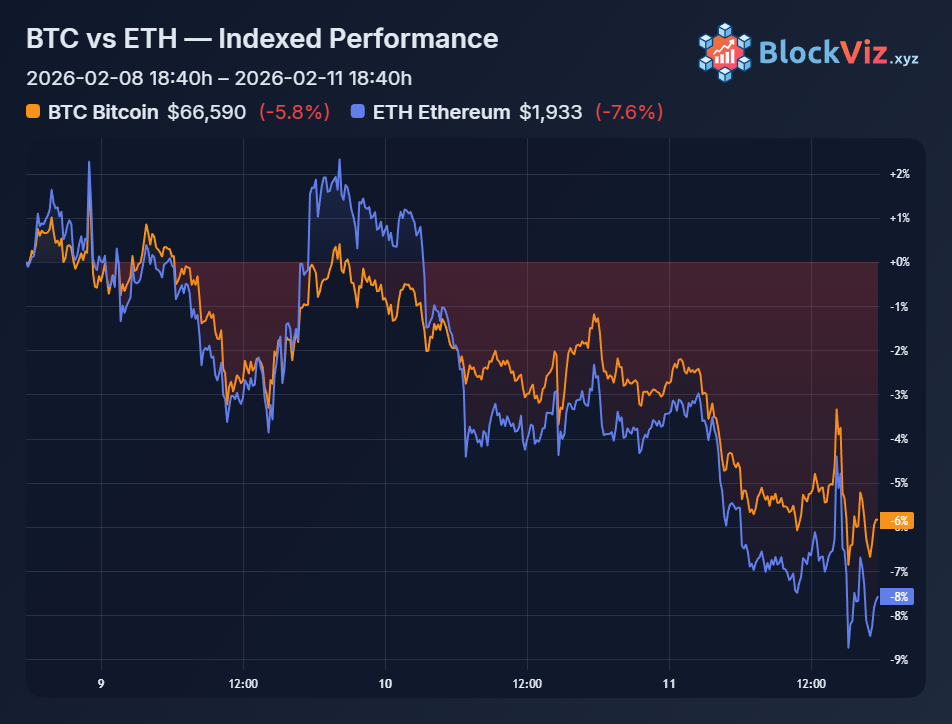
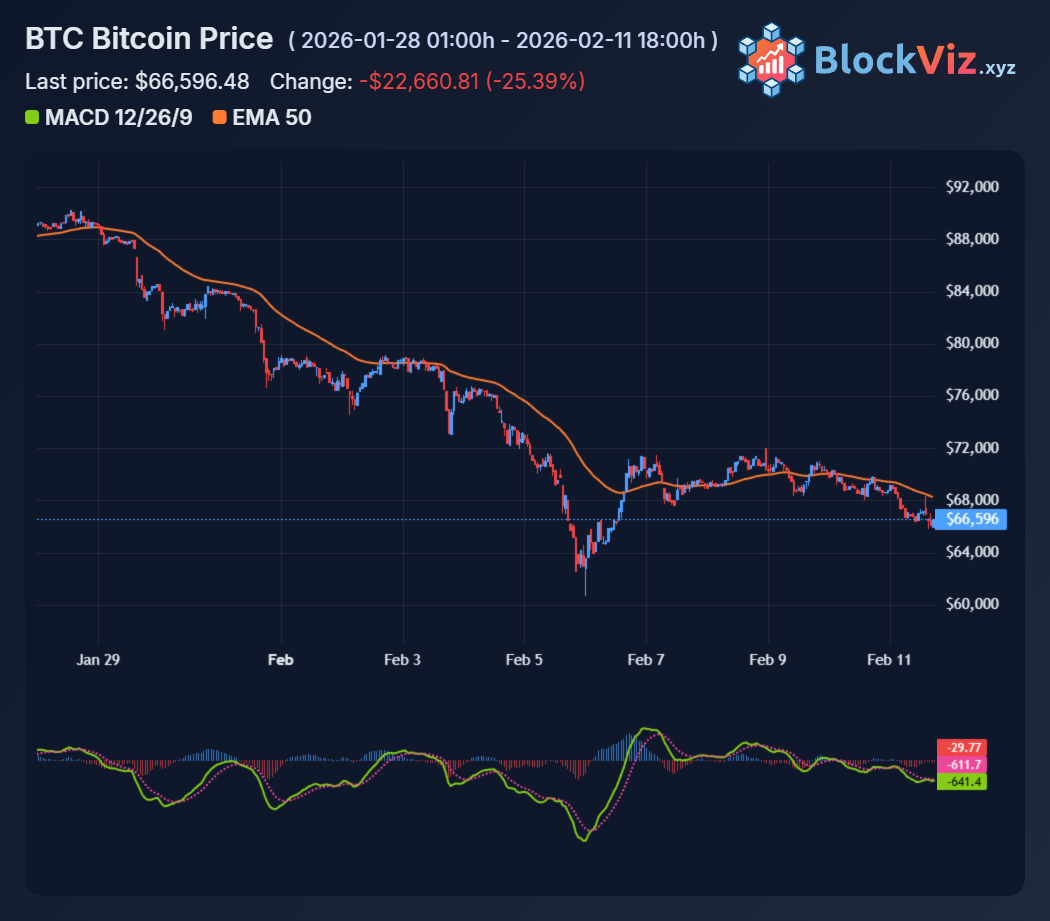
Bitcoin is failing at 70k after the brutal February selloff. Price action has compressed from the low $80Ks into a tight $60-70K band, with sellers capping rallies through precise, technical sellers’ pressure.
Root causes
• Macro pressures: Higher-for-longer rates are squeezing liquidity for high-risk assets, including crypto. Weakening equities and rising real yields push capital toward safer income assets, draining demand for Bitcoin as a speculative/digital-gold narrative.
• Structural shifts: Spot Bitcoin ETFs have pivoted from steady inflows to outright redemptions, removing a reliable daily buying source that supported prices for months. This coincided with crowded leverage near recent highs, triggering cascading liquidations across perpetual futures and centralized exchanges as stop-loss chains were hunted in downside momentum.
• Contagion and stress: Mining balance sheets suffer from elevated energy costs and post-halving revenue squeezes. AI/tech sector unwind spills into correlated risk assets. Altcoins tend to slide 1.5–3x BTC’s decline, turning a correction into a broad sector rout.
Psychology in the 4-year cycle context
The $70K standoff carries heavy four-year halving-cycle psychology. After peaks, post-peak corrections often retrace 30–50% of gains before the next accumulation phase starts roughly 12–18 months pre-halving. History (2018, 2022) shows shakeouts purge weak hands, reset overleverage, and rebuild sentiment from oversold conditions. Yet, a prolonged rejection risks a multi-quarter bear phase if macro conditions stay hostile, challenging even long-term holders.
Takeaway
Watch ETF flow reversals and liquidations for confirmation signals. A decisive break and close above $70K could restart the cycle with fresh bullish momentum. Failure below $65K opens the door to a deeper flush toward $55–60K cycle supports. Consider monitoring: ETF net flows, spot leverage, funding rates, and miner stress indicators.