
BlockVizBlockViz
Price
Market Cap
Portfolio
Simulators
Resources
Pricing

Price

  • KPI Tracker
  • Techn. Analysis Chart
  • Indexed Comparison
  • Asset Risk Analyzer
  • Best & Worst Days
  • Seasonality Heatmap

Market Cap

  • Dominance
  • Development
  • Treemap

Portfolio

  • Tracker
  • Development
  • Comparison
  • Risk Analyzer

Simulators

  • Market Cap Parity
  • HODL vs. DCA
  • Coin Flip
  • Sell and Buy Back
  • Stop Loss
  • Portfolio Rebalance

Resources

  • Coins
  • Guides
  • Wiki
  • Blog
  • News

Community

X.comCMCBinanceYouTubeLinkedInDiscord

Product

PricingRewardsPartnersAll Tools

Resources

CoinsGuidesWikiNews

Company

AboutContactSupportLegal

Data provided by

CoinGecko

© 2026 BlockViz.xyz
All rights reserved.

Home
›News

Latest News

Home
›News
›Trump’s Bitcoin Signal Reopens the Path Toward $80,000
Trump’s Bitcoin Signal Reopens the Path Toward $80,000

Trump’s Bitcoin Signal Reopens the Path Toward $80,000

August 20, 2026|By BlockViz Insights
BTC

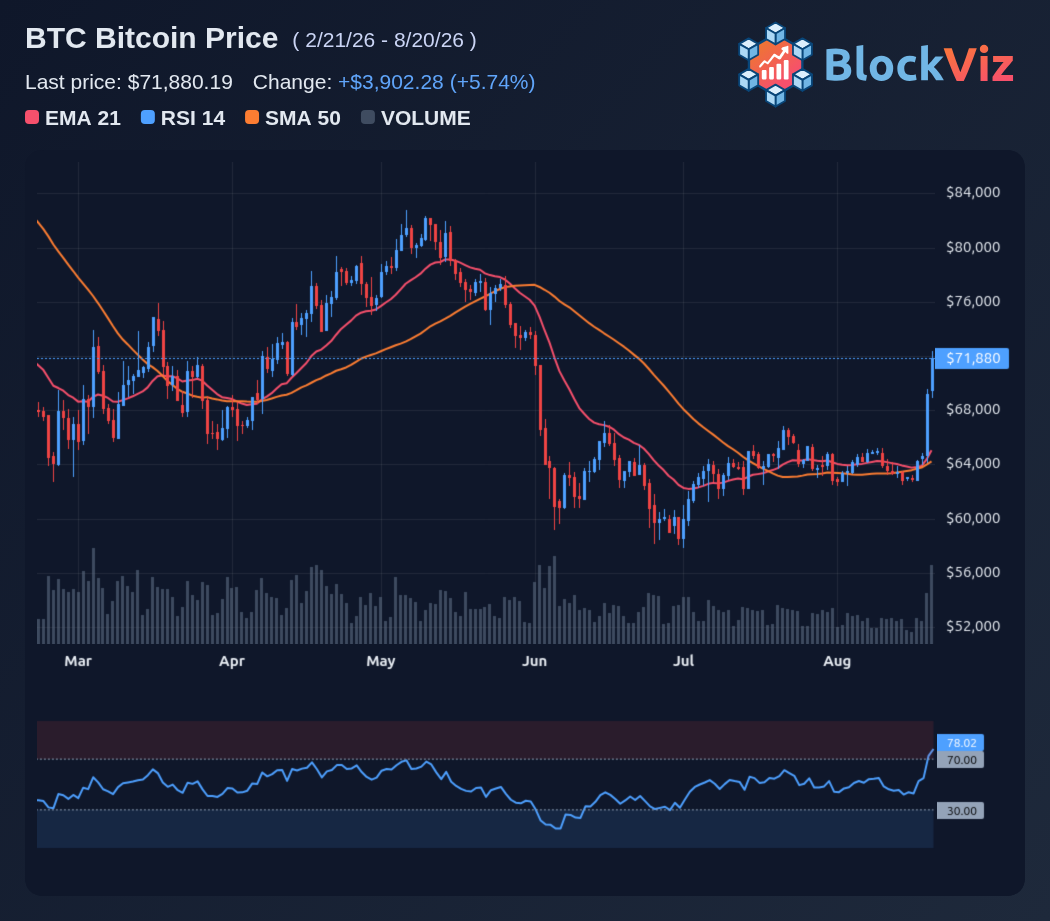
Trump putting a possible US bitcoin buy on the table has dragged $80,000 back into focus, but the market is still trading a signal, not a policy.

There is no order, no purchase timetable and no funding detail yet. That is why $70,000 matters so much here. BTC reclaimed it on the headline, and if that level holds while spot demand and ETF inflows stay firm, the path toward $75,000 and then $80,000 stays open.

The catch is that headlines alone usually do not carry a move that far. For $80,000 to come into play this month, the market likely needs real follow-through in liquidity, stronger spot volume and buyers absorbing supply without leverage doing all the work.

If the policy signal fades and $70,000 slips, the breakout case weakens quickly and $68,000 comes back into view. The next move depends less on the headline itself, and more on whether actual flows confirm it.
Technical Analysis Chart preview

Explore this related tool

Technical Analysis Chart

Use the interactive tool to explore the same concept with your own time range and settings.

Related Tool
Technical Analysis Chart

Technical Analysis Chart

Open Tool →

More News
Zcash’s Breakout Faces Its $800 Demand Test

Zcash’s Breakout Faces Its $800 Demand Test

Aug 24, 2026
XRP Outruns BTC and ETH, but the Bigger Upside Call Is Not Settled

XRP Outruns BTC and ETH, but the Bigger Upside Call Is Not Settled

Aug 21, 2026
Hayes’ FLOP Airdrop Reignites the Altcoin Rotation Debate

Hayes’ FLOP Airdrop Reignites the Altcoin Rotation Debate

Aug 19, 2026
Bitcoin’s 200-Week Support Line Turns Into a High-Stakes Test

Bitcoin’s 200-Week Support Line Turns Into a High-Stakes Test

Aug 18, 2026