
BlockVizBlockViz
Price
Market Cap
Portfolio
Simulators
Resources
Pricing

Price

  • KPI Tracker
  • Techn. Analysis Chart
  • Indexed Comparison
  • Asset Risk Analyzer
  • Best & Worst Days
  • Seasonality Heatmap

Market Cap

  • Dominance
  • Development
  • Treemap

Portfolio

  • Tracker
  • Development
  • Comparison
  • Risk Analyzer

Simulators

  • Market Cap Parity
  • HODL vs. DCA
  • Coin Flip
  • Sell and Buy Back
  • Stop Loss
  • Portfolio Rebalance

Resources

  • Coins
  • Guides
  • Wiki
  • Blog
  • News

Community

X.comCMCBinanceYouTubeLinkedInDiscord

Product

PricingRewardsPartnersAll Tools

Resources

CoinsGuidesWikiNews

Company

AboutContactSupportLegal

Data provided by

CoinGecko

© 2026 BlockViz.xyz
All rights reserved.

Home
›News

Latest News

Home
›News
›Bitcoin’s 200-Week Support Line Turns Into a High-Stakes Test
Bitcoin’s 200-Week Support Line Turns Into a High-Stakes Test

Bitcoin’s 200-Week Support Line Turns Into a High-Stakes Test

August 18, 2026|By BlockViz Insights
BTC

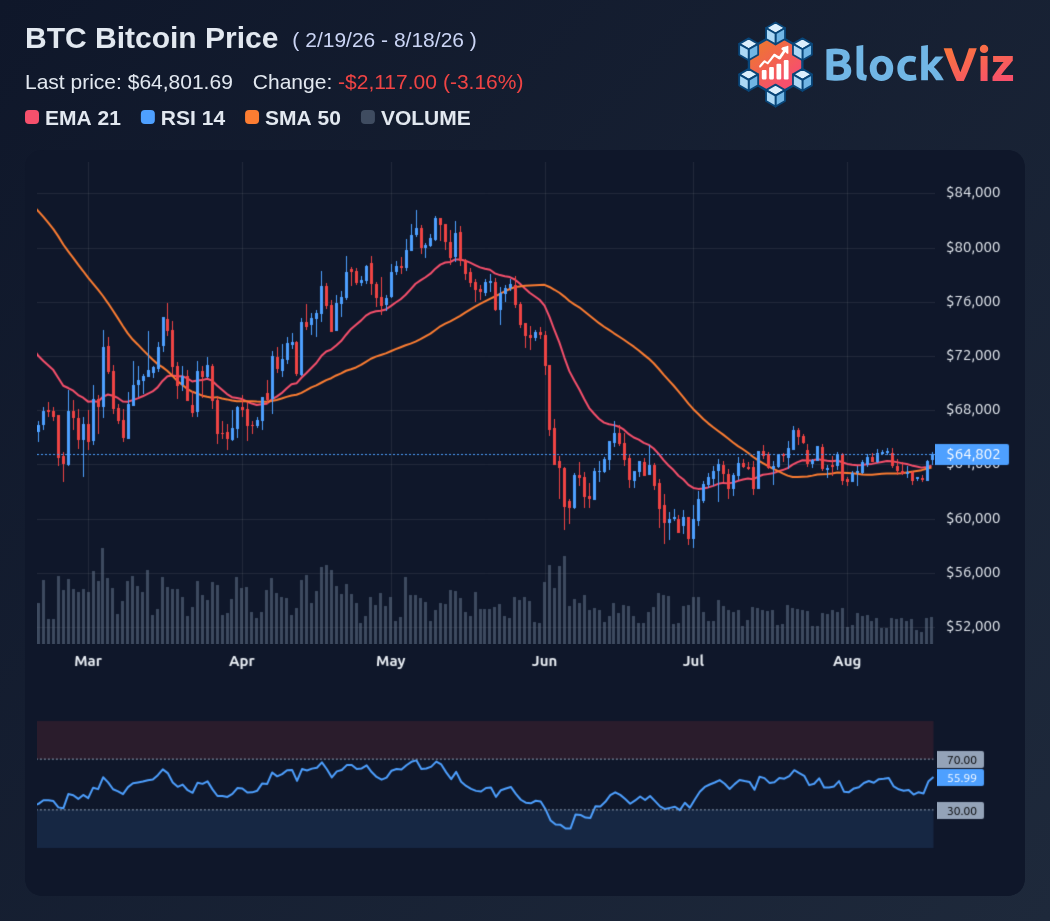
Bitcoin is back at a level that defined the 2022 breakdown: the 200-week moving average, now near $64,200.

BTC closed a weekly candle below it and still has not reclaimed it with conviction. That is the real tension here. If a level that acted as long-term support starts rejecting price from above, the market has to treat it differently.

The 2022 comparison matters because BTC spent more than a year trading below the 200-week average before recovering it in October 2023. That does not guarantee a repeat, but it does raise the stakes for this retest.

Right now, BTC is still moving inside a broad $57,700 to $67,300 range. The near-term battleground sits around $62,000 to $64,200. A clean reclaim of that zone, followed by strength back above $65,000, would argue that this break was temporary. More rejection below the 200-week average, especially if $62,000 gives way, would put the lower end of the range near $58,000 back in focus.

For now, the weekly close matters more than intraday noise. Until BTC gets back above the 200-week line and holds it, every bounce into that area is still vulnerable to selling.
Technical Analysis Chart preview

Explore this related tool

Technical Analysis Chart

Use the interactive tool to explore the same concept with your own time range and settings.

Related Tool
Technical Analysis Chart

Technical Analysis Chart

Open Tool →

More News
Trump’s Bitcoin Signal Reopens the Path Toward $80,000

Trump’s Bitcoin Signal Reopens the Path Toward $80,000

Aug 20, 2026
Hayes’ FLOP Airdrop Reignites the Altcoin Rotation Debate

Hayes’ FLOP Airdrop Reignites the Altcoin Rotation Debate

Aug 19, 2026
Bitcoin Tests August Weakness as Buyers Aim to Break the Pattern

Bitcoin Tests August Weakness as Buyers Aim to Break the Pattern

Aug 17, 2026
Strategy’s $53B Bitcoin Treasury Faces an MSCI Stress Test

Strategy’s $53B Bitcoin Treasury Faces an MSCI Stress Test

Aug 14, 2026