BlockVizBlockViz
Price
Market Cap
Portfolio
Simulators
Resources
Pricing

Price

  • KPI Tracker
  • Techn. Analysis Chart
  • Indexed Comparison
  • Asset Risk Analyzer
  • Best & Worst Days
  • Seasonality Heatmap

Market Cap

  • Dominance
  • Development
  • Treemap

Portfolio

  • Tracker
  • Development
  • Comparison
  • Risk Analyzer

Simulators

  • Market Cap Parity
  • HODL vs. DCA
  • Coin Flip
  • Sell and Buy Back
  • Stop Loss
  • Portfolio Rebalance

Resources

  • Coins
  • Guides
  • Wiki
  • Blog
  • News

Community

X.comCMCBinanceYouTubeLinkedInDiscord

Product

PricingRewardsPartnersAll Tools

Resources

CoinsGuidesWikiNews

Company

AboutContactSupportLegal

Data provided by

CoinGecko

© 2026 BlockViz.xyz
All rights reserved.

Home
›News

Latest News

Home
›News
›XRP Outruns BTC and ETH, but the Bigger Upside Call Is Not Settled
XRP Outruns BTC and ETH, but the Bigger Upside Call Is Not Settled

XRP Outruns BTC and ETH, but the Bigger Upside Call Is Not Settled

August 21, 2026|By BlockViz Insights
XRPETHBTC

XRP is outperforming BTC and ETH right now, but that alone does not settle the upside debate.

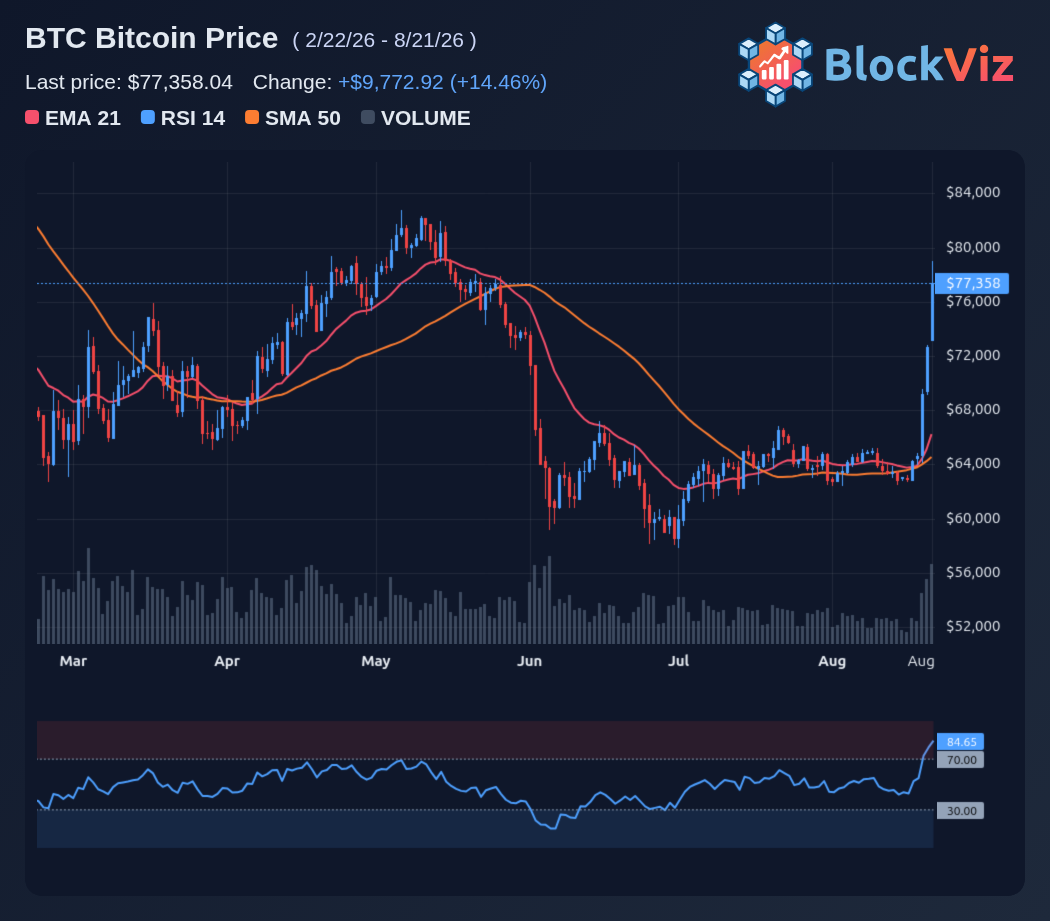
XRP is up roughly 18% in 24 hours and trading above $1.30. BTC is up about 9%, and ETH has also rebounded hard after recovering from near $1,800. That makes XRP the highest-torque move of the three, but also the one most exposed if momentum fades.

The case for XRP is straightforward: a catch-up rally, improving regulatory sentiment, and short covering after the move back above $1. If buyers keep control, the $1.40 to $1.50 zone comes into focus.

ETH still has a strong momentum case if it holds above $2,300 and keeps pulling in institutional flows. BTC remains the cleaner trend anchor if it holds above $70,000 and continues supporting broader risk appetite.

The real test for XRP starts after the squeeze effect cools off. If it can hold above $1.20 with strong spot volume, firm open interest, and stable funding while still outperforming BTC and ETH, the upside case gets stronger. If volume dries up, this may look more like a fast rotation than a lasting repricing.
Technical Analysis Chart preview

Explore this related tool

Technical Analysis Chart

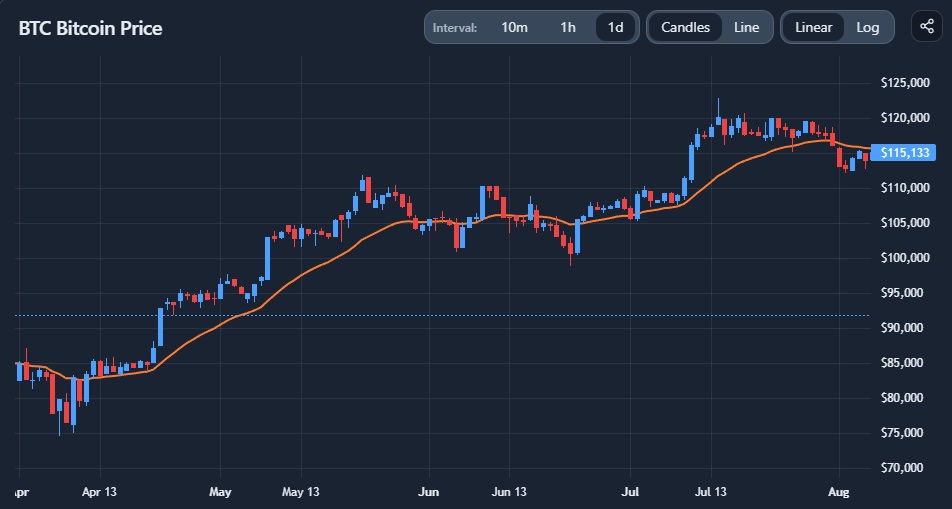
Use the interactive tool to explore the same concept with your own time range and settings.

Related Tool
Technical Analysis Chart

Technical Analysis Chart

Open Tool →

More News
Trump’s Bitcoin Signal Reopens the Path Toward $80,000

Trump’s Bitcoin Signal Reopens the Path Toward $80,000

Aug 20, 2026
Hayes’ FLOP Airdrop Reignites the Altcoin Rotation Debate

Hayes’ FLOP Airdrop Reignites the Altcoin Rotation Debate

Aug 19, 2026
Bitcoin’s 200-Week Support Line Turns Into a High-Stakes Test

Bitcoin’s 200-Week Support Line Turns Into a High-Stakes Test

Aug 18, 2026
Bitcoin Tests August Weakness as Buyers Aim to Break the Pattern

Bitcoin Tests August Weakness as Buyers Aim to Break the Pattern

Aug 17, 2026