Bitcoin’s RSI Hits Most Oversold Since 2023: Bottom in Sight or More Pain Ahead?
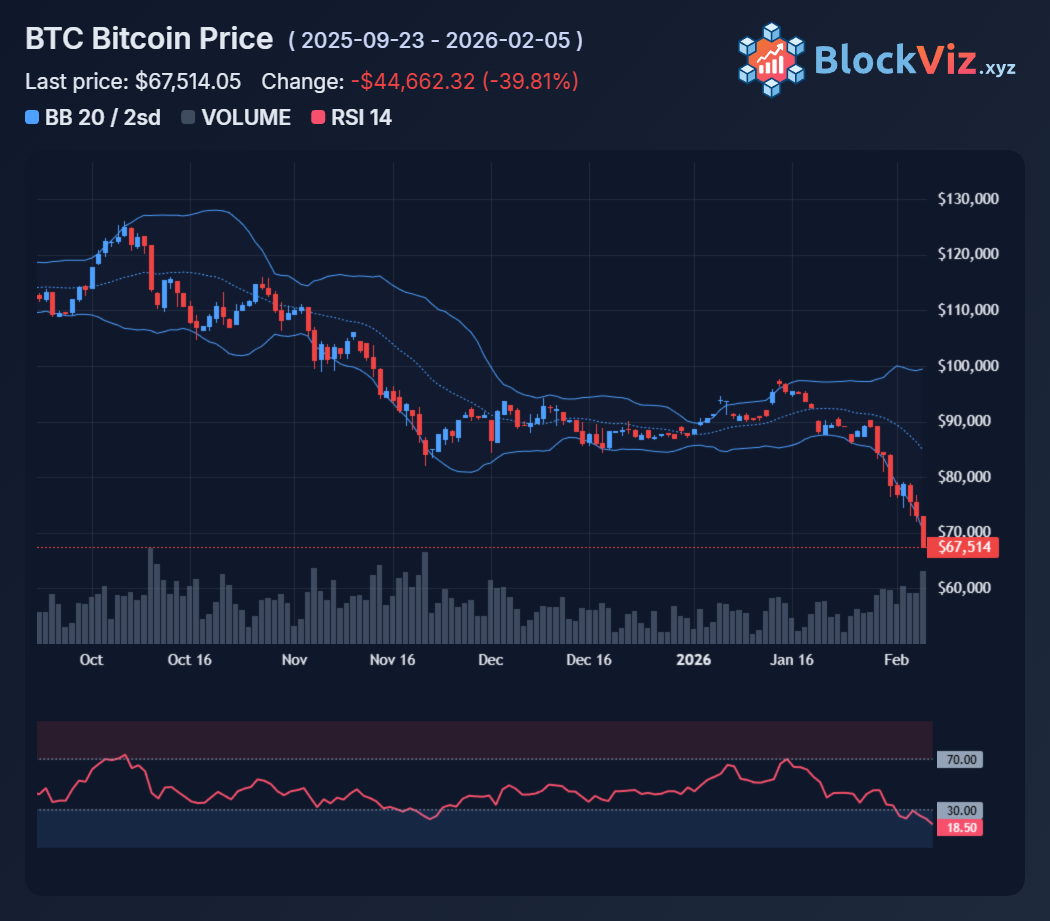
Bitcoin daily RSI has cratered below 20 today, the weakest print since mid-2023 bear-market lows. Weekly timeframes echo that exhaustion, flashing oversold not seen since 2022's capitulation wipeout. With price slicing below 80K support amid $1B+ long liquidations, the market's screaming for relief; but where does this actually bottom?
How Extreme Is This Signal?
Daily RSI sub-25 marks true oversold territory, historically a precursor to sharp bounces when paired with extreme Fear & Greed readings and plunging open interest. This week's flush liquidated over a billion in longs, flushed late-2025 euphoria, and broke key trend MAs—classic capitulation setup. But oversold can stay oversold, especially if ETF outflows persist and macro risk-off lingers.
My Bottom Target Range
No single price, but a high-probability zone based on technical structure and historical analogs:
• Immediate capitulation test: $70K. Major psychological and technical magnet where short-term sellers target stops. Expect volatility here as trapped longs exit.
• Max pain extension: $65K–$68K. Clears 2025 cycle highs, runs liquidity below round numbers, and pushes RSI to 2022-washout extremes. Below mid-60Ks risks damaging the whole supercycle narrative.
Trading the Bottom Process
RSI curls don't guarantee instant reversal—price often wicks lower first. Treat $70K–$65K as the base-building zone:
• Confirmation: Higher lows forming with RSI hooking up, ETF flows stabilizing, OI rebuilding post-flush.
• Risk: Continued red ETF prints or macro shocks (Iran, yields) send it to max pain.