
BlockVizBlockViz
Price
Market Cap
Portfolio
Simulators
Resources
Pricing

Price

  • KPI Tracker
  • Techn. Analysis Chart
  • Indexed Comparison
  • Asset Risk Analyzer
  • Best & Worst Days
  • Seasonality Heatmap

Market Cap

  • Dominance
  • Development
  • Treemap

Portfolio

  • Tracker
  • Development
  • Comparison
  • Risk Analyzer

Simulators

  • Market Cap Parity
  • HODL vs. DCA
  • Coin Flip
  • Sell and Buy Back
  • Stop Loss
  • Portfolio Rebalance

Resources

  • Coins
  • Guides
  • Wiki
  • Blog
  • News

Community

X.comCMCBinanceYouTubeLinkedInDiscord

Product

PricingRewardsPartnersAll Tools

Resources

CoinsGuidesWikiNews

Company

AboutContactSupportLegal

Data provided by

CoinGecko

© 2026 BlockViz.xyz
All rights reserved.

Home
›News

Latest News

Home
›News
›Bitcoin Tests $82,000 Support as ETF Buyers and Longs Face Liquidation Risk
Bitcoin Tests $82,000 Support as ETF Buyers and Longs Face Liquidation Risk

Bitcoin Tests $82,000 Support as ETF Buyers and Longs Face Liquidation Risk

October 6, 2026|By BlockViz Insights
BTC

BTC is hovering around 82,000 to 84,000 after last week's 2.4 billion dollar ETF inflow surge, and the market is asking the obvious question. Who gets liquidated first on a 3% dip? The 82,000 level is the strongest nearby support, sitting near the ETF holder cost basis around 81,700 to 82,500 and the breakout zone from August that must hold for the bull case to stay intact.

The tension is between leveraged longs and ETF buyers. Futures open interest sits around 52 billion, down 14% from recent peaks, but long liquidation clusters are stacked between 75,000 and 76,000 and then 60,000 to 63,000. A 3% dip from 83,000 would take BTC to roughly 80,500, testing the ETF breakeven and the corporate treasury cost basis near 80,500. That is where the first wave of long liquidations would hit, with the 75,000 to 76,000 zone acting as the next major support.

For traders, the setup is about defense and flow. Watch 82,000 as the key pivot and 83,300 to 83,500 as immediate support. A break below 82,000 could open the path to 80,500 and then 78,000, with long liquidations accelerating into the 75,000 to 76,000 cluster. The ETF buyers are the marginal bid, and their 81,700 to 82,500 cost basis is the line that must hold to avoid a deeper flush.

The next catalysts are the October monthly candle open and any follow-through in ETF flows. A hold above 82,000 with continued inflows would signal the breakout zone is solid, while a break below could trigger a 3% to 5% dip into 78,000 to 80,000 before the long liquidation cascade eases. Watch the liquidation heatmap for the 75,000 to 76,000 cluster and the 82,000 pivot for the next move.
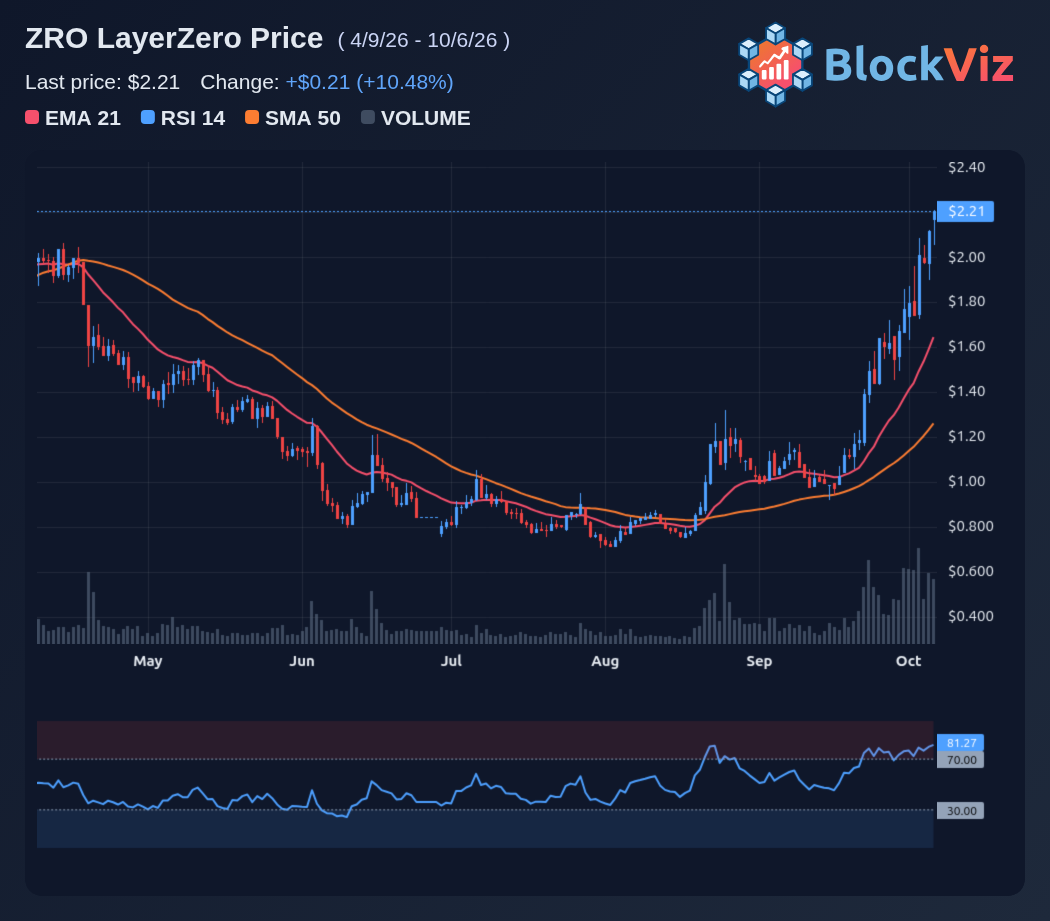
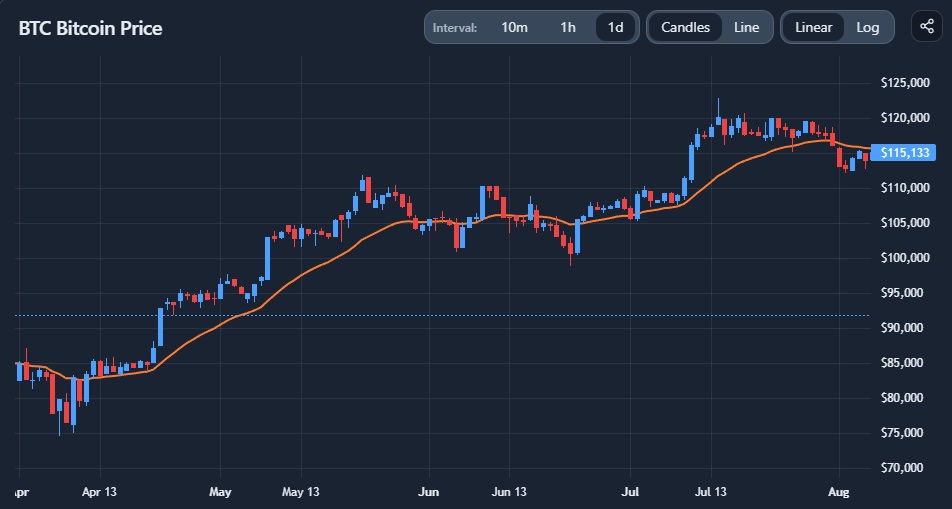
Technical Analysis Chart preview

Explore this related tool

Technical Analysis Chart

Use the interactive tool to explore the same concept with your own time range and settings.

Related Tool
Technical Analysis Chart

Technical Analysis Chart

Open Tool →

More News
Bitcoin Tests $82,000 Support as ETF Buyers and Longs Face Liquidation Risk

Bitcoin Tests $82,000 Support as ETF Buyers and Longs Face Liquidation Risk

Oct 5, 2026
Bitcoin Tests $82,000 Support as ETF Buyers and Longs Face Liquidation Risk

Bitcoin Tests $82,000 Support as ETF Buyers and Longs Face Liquidation Risk

Oct 2, 2026
Altcoin Spot Volume Hits 4x Bitcoin as Traders Debate Early Altseason

Altcoin Spot Volume Hits 4x Bitcoin as Traders Debate Early Altseason

Sep 29, 2026
THORChain Refuses to Block Bitget Hacker Wallets in Censorship Resistance Stand

THORChain Refuses to Block Bitget Hacker Wallets in Censorship Resistance Stand

Sep 28, 2026