
BlockVizBlockViz
Price
Market Cap
Portfolio
Simulators
Resources
Pricing

Price

  • KPI Tracker
  • Techn. Analysis Chart
  • Indexed Comparison
  • Asset Risk Analyzer
  • Best & Worst Days
  • Seasonality Heatmap

Market Cap

  • Dominance
  • Development
  • Treemap

Portfolio

  • Tracker
  • Development
  • Comparison
  • Risk Analyzer

Simulators

  • Market Cap Parity
  • HODL vs. DCA
  • Coin Flip
  • Sell and Buy Back
  • Stop Loss
  • Portfolio Rebalance

Resources

  • Coins
  • Guides
  • Wiki
  • Blog
  • News

Community

X.comCMCBinanceYouTubeLinkedInDiscord

Product

PricingRewardsPartnersAll Tools

Resources

CoinsGuidesWikiNews

Company

AboutContactSupportLegal

Data provided by

CoinGecko

© 2026 BlockViz.xyz
All rights reserved.

Home
›News

Latest News

Home
›News
›Treasury's 15.6 Billion Bond Buyback Fuels Bitcoin Rally Amid Fed Rate Hike
Treasury's 15.6 Billion Bond Buyback Fuels Bitcoin Rally Amid Fed Rate Hike

Treasury's 15.6 Billion Bond Buyback Fuels Bitcoin Rally Amid Fed Rate Hike

September 18, 2026|By BlockViz Insights
BTC

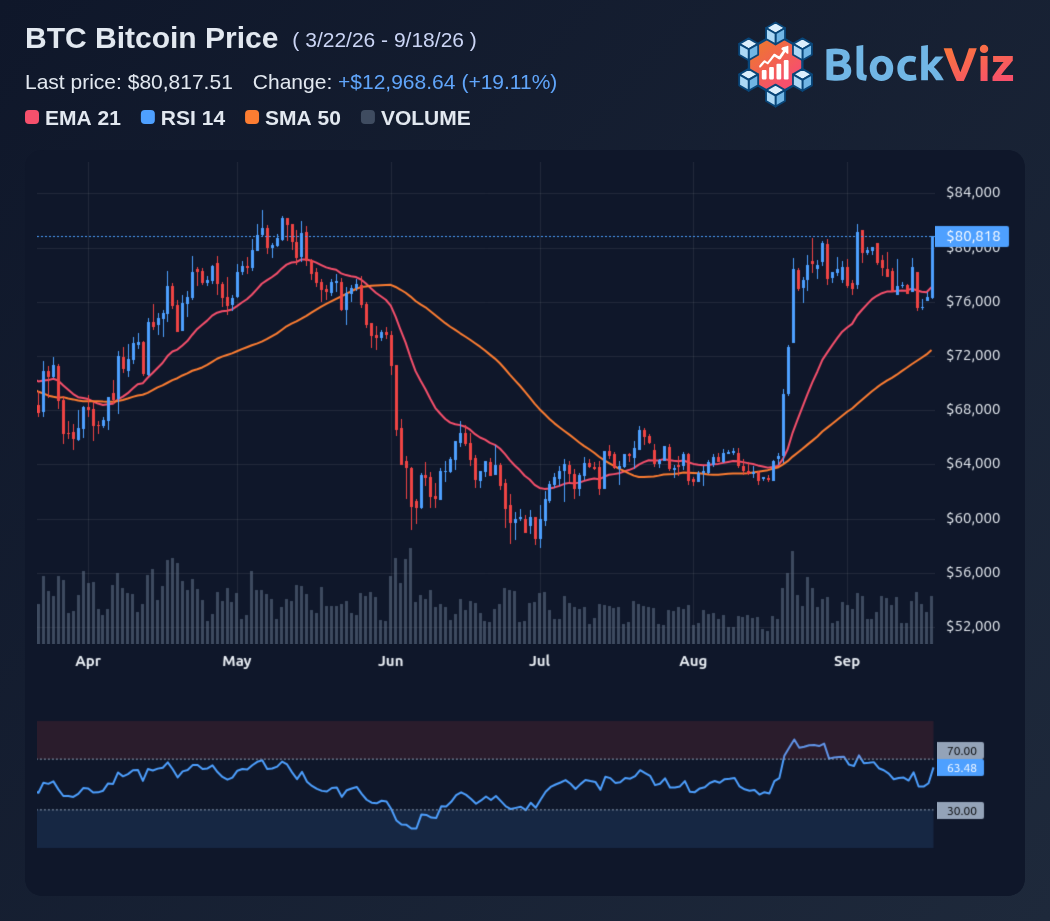
The Fed just hiked rates, but the market is fixated on a different number: 15.6 billion. That is the size of the Treasury's latest bond buyback operation, and it has traders asking whether this is stealth QE that is fueling Bitcoin's breakout toward 80,000.

The tension is real. On one side, the Fed raised the policy rate by 25 basis points to 3.75% to 4.00%, the first hike since 2023, and signaled a hawkish path with one more increase possible by year end. On the other side, the Treasury is injecting liquidity through debt buybacks, with up to 14.5 billion per week in purchases and a 15.6 billion operation hitting the market this week. That combination of tightening policy and targeted liquidity is exactly what has BTC ripping from the 76,000s back toward 77,300 to 78,000.

For traders, the question is whether this liquidity bid is enough to offset the headwinds from higher rates, ETF outflows, and the Clarity Act setback. BTC has already recovered from a July low near 58,000, gaining nearly 33% into mid-September, but it still faces heavy resistance at 78,000 and then the 365-day moving average near 82,300. A clean break above 78,000 would signal that the Treasury liquidity injection is winning, while a failure could see BTC slide back toward 74,000 to 75,000.

Watch the next Treasury buyback announcements and the Fed's balance sheet data for signs of continued liquidity support. The key levels are 78,000 on the upside and 74,000 on the downside. If the 15.6 billion operation is just the start of a larger program, BTC could test 80,000 and then 82,300. If the liquidity tap slows, the hawkish Fed path will likely dominate and push BTC back toward 70,000.
Technical Analysis Chart preview

Explore this related tool

Technical Analysis Chart

Use the interactive tool to explore the same concept with your own time range and settings.

Related Tool
Technical Analysis Chart

Technical Analysis Chart

Open Tool →

More News
Privacy Trade Split as Hackers Back Monero and VCs Pile Into Zcash

Privacy Trade Split as Hackers Back Monero and VCs Pile Into Zcash

Sep 17, 2026
Markets Brace for First Fed Hike in Three Years as Crypto Balances on Surprise Hold

Markets Brace for First Fed Hike in Three Years as Crypto Balances on Surprise Hold

Sep 16, 2026
Clarity Act Passage Odds Collapse to 14% Ahead of 60-Vote Senate Test

Clarity Act Passage Odds Collapse to 14% Ahead of 60-Vote Senate Test

Sep 15, 2026
BlackRock Accumulates ETH for 20 Straight Days as Wall Street Tests Ethereum Over Bitcoin

BlackRock Accumulates ETH for 20 Straight Days as Wall Street Tests Ethereum Over Bitcoin

Sep 11, 2026