
BlockVizBlockViz
Price
Market Cap
Portfolio
Simulators
Resources
Pricing

Price

  • KPI Tracker
  • Techn. Analysis Chart
  • Indexed Comparison
  • Asset Risk Analyzer
  • Best & Worst Days
  • Seasonality Heatmap

Market Cap

  • Dominance
  • Development
  • Treemap

Portfolio

  • Tracker
  • Development
  • Comparison
  • Risk Analyzer

Simulators

  • Market Cap Parity
  • HODL vs. DCA
  • Coin Flip
  • Sell and Buy Back
  • Stop Loss
  • Portfolio Rebalance

Resources

  • Coins
  • Guides
  • Wiki
  • Blog
  • News

Community

X.comCMCBinanceYouTubeLinkedInDiscord

Product

PricingRewardsPartnersAll Tools

Resources

CoinsGuidesWikiNews

Company

AboutContactSupportLegal

Data provided by

CoinGecko

© 2026 BlockViz.xyz
All rights reserved.

Home
›News

Latest News

Home
›News
›White Hats or Hostage Takers: $320M BTC Drain Puts Liquid Network on Pause
White Hats or Hostage Takers: $320M BTC Drain Puts Liquid Network on Pause

White Hats or Hostage Takers: $320M BTC Drain Puts Liquid Network on Pause

September 7, 2026|By BlockViz Insights
BTC

Bitcoin is flirting with one of its most watched technical signals, and the history behind it is hard to ignore. The 50-day moving average is closing in on the 200-day line, setting up a potential golden cross that has only delivered massive moves a few times in the past. In 2012, 2015 and 2020, this pattern preceded gains of more than 300% over the following year.

That does not mean 100K is automatic. BTC is currently consolidating between 75,000 and 82,000 after a strong August, but it still needs a decisive break above the 81,500 to 84,400 supply zone to reopen the path toward 98,000 and 100,000. The golden cross itself is a lagging signal, so price action must confirm it.

The bullish case improves if BTC holds above 80,000, completes the cross and attracts fresh ETF inflows while macro pressure eases. The bearish risk is a failure at 82,000 to 84,400, followed by a drop back below 75,000 and a test of the 200-day average near 72,500.

Traders should watch the 50-day and 200-day convergence, a daily close above 84,400 as breakout confirmation, and whether support at 75,000 to 76,800 holds. If the cross forms with strong volume and institutional flows, 100K moves from narrative to realistic target. If price rejects hard at resistance, the signal may prove to be another false start.

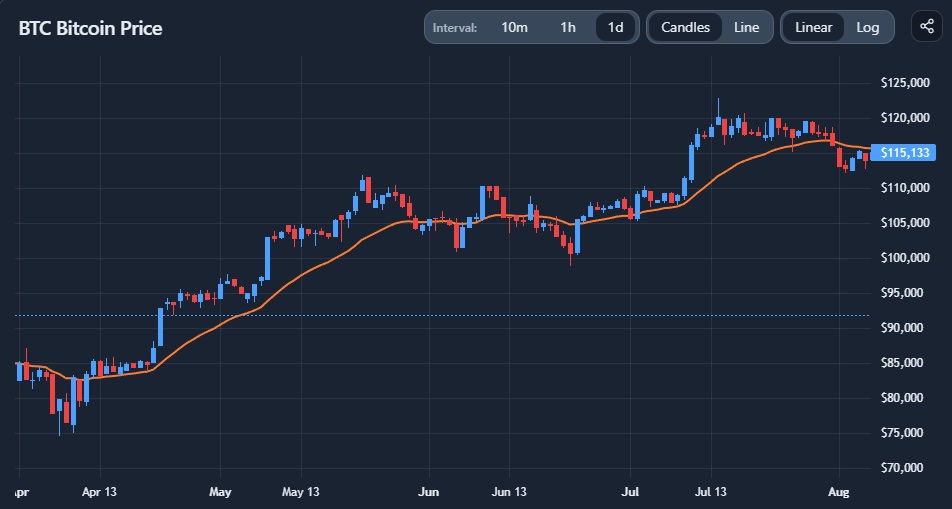
Technical Analysis Chart preview

Explore this related tool

Technical Analysis Chart

Use the interactive tool to explore the same concept with your own time range and settings.

Related Tool
Technical Analysis Chart

Technical Analysis Chart

Open Tool →

More News
ZEC and XRP Break Higher, but BTC Dominance Still Clouds the Altseason Call

ZEC and XRP Break Higher, but BTC Dominance Still Clouds the Altseason Call

Sep 4, 2026
Bitcoin Nears Golden Cross as $84.4K Break Becomes the Real Test

Bitcoin Nears Golden Cross as $84.4K Break Becomes the Real Test

Sep 3, 2026
Iran News Triggers $115M BTC Long Flush as $75K Support Comes Into Focus

Iran News Triggers $115M BTC Long Flush as $75K Support Comes Into Focus

Sep 2, 2026
Robinhood Chain Tops Ethereum in Daily App Revenue, Fueled by a Memecoin Surge

Robinhood Chain Tops Ethereum in Daily App Revenue, Fueled by a Memecoin Surge

Sep 1, 2026