BlockVizBlockViz
Price
Market Cap
Portfolio
Simulators
Resources
Pricing

Price

  • KPI Tracker
  • Techn. Analysis Chart
  • Indexed Comparison
  • Asset Risk Analyzer
  • Best & Worst Days
  • Seasonality Heatmap

Market Cap

  • Dominance
  • Development
  • Treemap

Portfolio

  • Tracker
  • Development
  • Comparison
  • Risk Analyzer

Simulators

  • Market Cap Parity
  • HODL vs. DCA
  • Coin Flip
  • Sell and Buy Back
  • Stop Loss
  • Portfolio Rebalance

Resources

  • Coins
  • Guides
  • Wiki
  • Blog
  • News

Community

X.comCMCBinanceYouTubeLinkedInDiscord

Product

PricingRewardsPartnersAll Tools

Resources

CoinsGuidesWikiNews

Company

AboutContactSupportLegal

Data provided by

CoinGecko

© 2026 BlockViz.xyz
All rights reserved.

Home
›News

Latest News

Home
›News
›Bitcoin Shorts Burn $200M as Bears Misread the Dip
Bitcoin Shorts Burn $200M as Bears Misread the Dip

Bitcoin Shorts Burn $200M as Bears Misread the Dip

April 6, 2026|By BlockViz Insights
BTC

Bears just ate a $200M loss trying to short Bitcoin into weakness, and that tells you more about positioning than price. The market is still doing the one thing that punishes both sides: it makes dip shorts look clever right before they get squeezed.

Why do traders keep doing it? Because BTC still looks fragile on the chart, so every bounce tempts bears to fade strength and every pullback feels like the last chance to sell higher. But when daily realized losses on large holders are already running above $200M and liquidity is thin, the same setup keeps inviting crowded shorts into the fire.

That is the real tension here. Bitcoin does not need a massive breakout to hurt bears. It only needs a shallow rebound, a weak short base, and one fast move through an obvious level to force covering. In this market, the pain trade often starts before the crowd agrees the move is real.

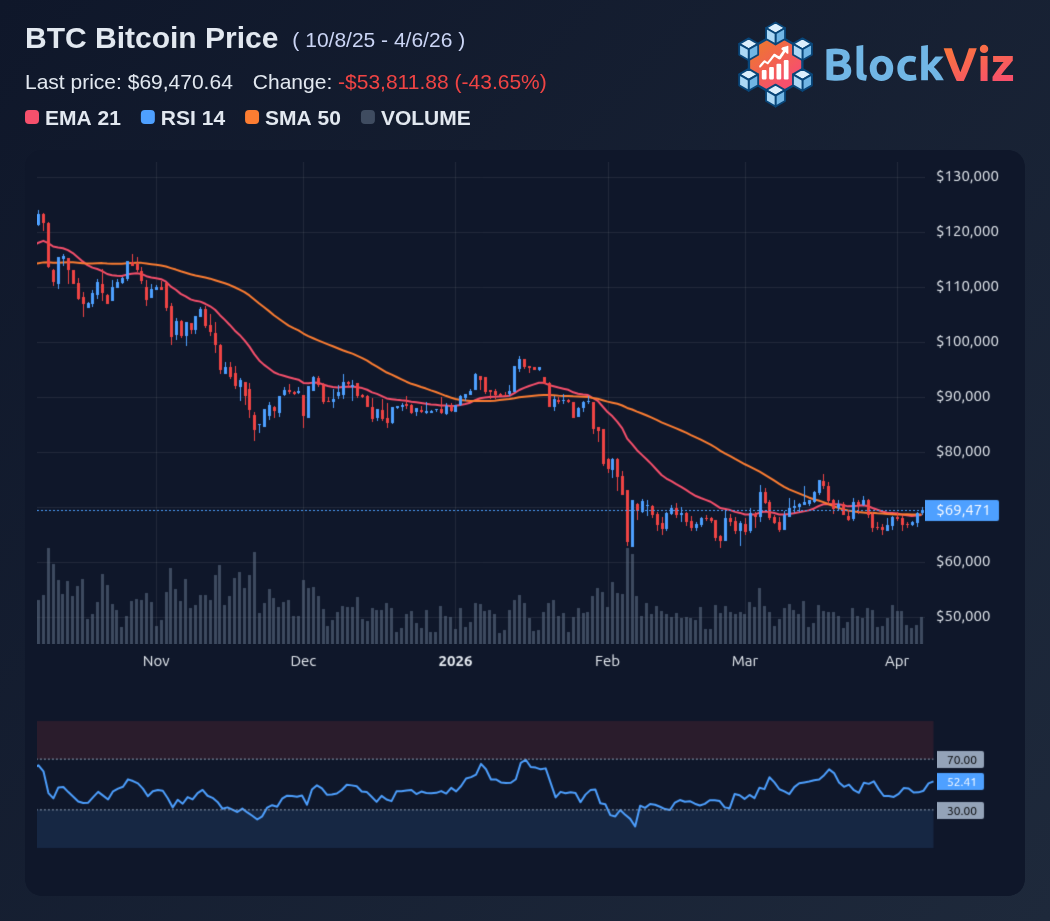
The market's immediate focus will be on whether Bitcoin can maintain key support levels. Observing if downside buying persists and if liquidation spikes emerge on upward movements will be crucial for understanding the prevailing market structure and sentiment regarding this dip.

Technical Analysis Chart preview

Explore this related tool

Technical Analysis Chart

Use the interactive tool to explore the same concept with your own time range and settings.

Related Tool
Technical Analysis Chart

Technical Analysis Chart

Open Tool →

More News
Solana DeFi Faces Trust Shock After $285M Exploit

Solana DeFi Faces Trust Shock After $285M Exploit

Apr 3, 2026
Market Shifts as BTC Tests $70K on Easing Geopolitical Tension

Market Shifts as BTC Tests $70K on Easing Geopolitical Tension

Apr 2, 2026
Markets Eye De-Escalation as Trump Predicts Iran Conflict End Within Weeks

Markets Eye De-Escalation as Trump Predicts Iran Conflict End Within Weeks

Apr 1, 2026
Quantum Countdown: Bitcoin’s 9-Minute Security Window

Quantum Countdown: Bitcoin’s 9-Minute Security Window

Mar 31, 2026