BlockVizBlockViz
Price
Market Cap
Portfolio
Simulators
Resources
Pricing

Price

  • KPI Tracker
  • Techn. Analysis Chart
  • Indexed Comparison
  • Asset Risk Analyzer
  • Best & Worst Days
  • Seasonality Heatmap

Market Cap

  • Dominance
  • Development
  • Treemap

Portfolio

  • Tracker
  • Development
  • Comparison
  • Risk Analyzer

Simulators

  • Market Cap Parity
  • HODL vs. DCA
  • Coin Flip
  • Sell and Buy Back
  • Stop Loss
  • Portfolio Rebalance

Resources

  • Coins
  • Guides
  • Wiki
  • Blog
  • News

Community

X.comCMCBinanceYouTubeLinkedInDiscord

Product

PricingRewardsPartnersAll Tools

Resources

CoinsGuidesWikiNews

Company

AboutContactSupportLegal

Data provided by

CoinGecko

© 2026 BlockViz.xyz
All rights reserved.

Home
›News

Latest News

Home
›News
›Historic Bitcoin Whale Sells $100M as Fed Holds Rates Steady
Historic Bitcoin Whale Sells $100M as Fed Holds Rates Steady

Historic Bitcoin Whale Sells $100M as Fed Holds Rates Steady

March 19, 2026|By BlockViz Insights
BTC

OG whales just trimmed another chunk, selling over $100M in BTC right after the Fed's hawkish rate freeze at 3.5-3.75%. That 2013 vintage wallet, acquired at $332 apiece, has now offloaded half its 5K stack since late 2024, realizing 31,000% gains in measured 250-500 BTC increments. This indicates strategic rotation amidst Powell's inflation warnings and oil spikes, rather than panic.

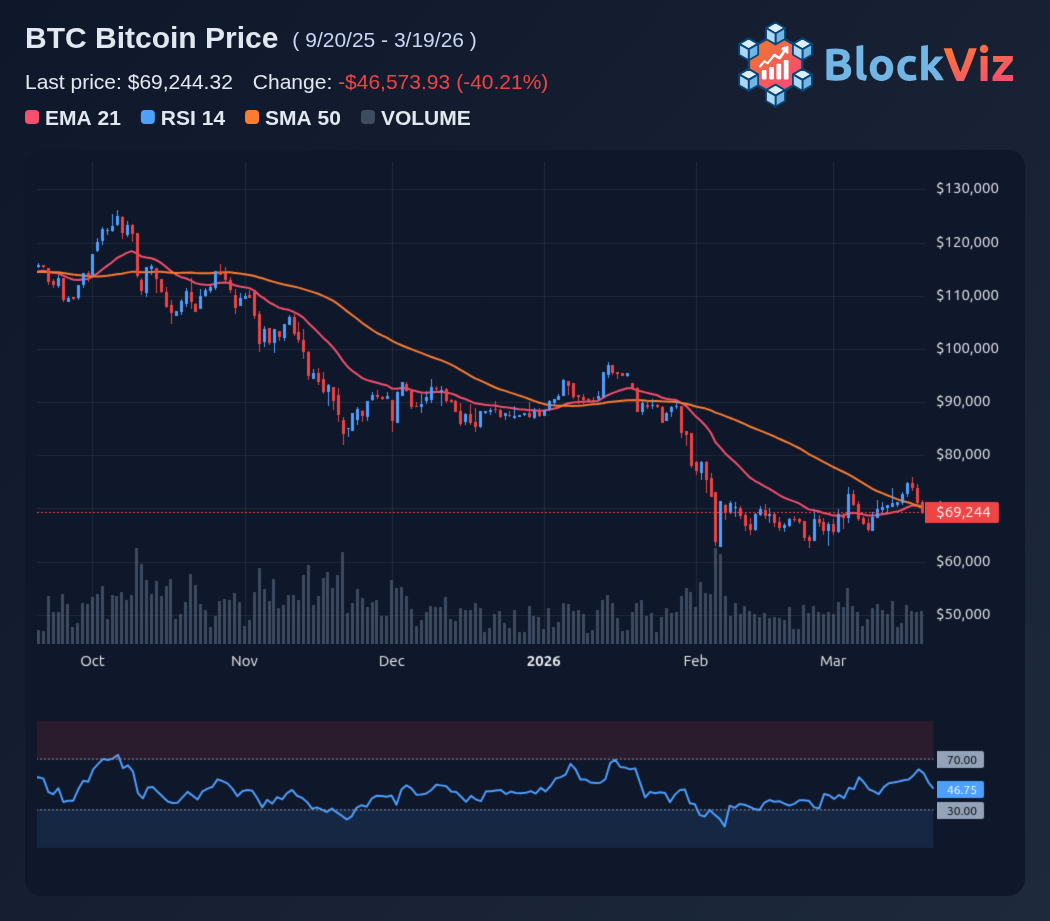
BTC dipped 1.7% to $73,700 on the news, testing a key support level after an 18% year-to-date slide. Institutions absorbed most of 2025's record OG selling, but this fresh flow holds more weight with the Fed signaling just one rate cut for the year. Liquidity is currently cushioning the impact, yet $44B daily volume is showing signs of strain as potential ETF outflows loom.

The implications of this whale activity will be important. A sustained hold above $70K is crucial, as is monitoring ETF flows and future Fed signals from Powell. These elements will provide insights into the market's trajectory.

Technical Analysis Chart preview

Explore this related tool

Technical Analysis Chart

Use the interactive tool to explore the same concept with your own time range and settings.

Related Tool
Technical Analysis Chart

Technical Analysis Chart

Open Tool →

More News
XRP Wallet Growth Hits Record as Price Clears $1.60 Resistance

XRP Wallet Growth Hits Record as Price Clears $1.60 Resistance

Mar 17, 2026
Bitcoin’s Eight-Day Rally Signals Thin Supply and Macro Relief

Bitcoin’s Eight-Day Rally Signals Thin Supply and Macro Relief

Mar 16, 2026
Bitcoin Excels in Geopolitical Stress Test as Stocks Decline

Bitcoin Excels in Geopolitical Stress Test as Stocks Decline

Mar 13, 2026
BlackRock's Staked ETH ETF Launches: Can ETHB Drive ETH Past BTC?

BlackRock's Staked ETH ETF Launches: Can ETHB Drive ETH Past BTC?

Mar 12, 2026