BlockVizBlockViz
Price
Market Cap
Portfolio
Simulators
Resources
Pricing

Price

  • KPI Tracker
  • Techn. Analysis Chart
  • Indexed Comparison
  • Asset Risk Analyzer
  • Best & Worst Days
  • Seasonality Heatmap

Market Cap

  • Dominance
  • Development
  • Treemap

Portfolio

  • Tracker
  • Development
  • Comparison
  • Risk Analyzer

Simulators

  • Market Cap Parity
  • HODL vs. DCA
  • Coin Flip
  • Sell and Buy Back
  • Stop Loss
  • Portfolio Rebalance

Resources

  • Coins
  • Guides
  • Wiki
  • Blog
  • News

Community

X.comCMCBinanceYouTubeLinkedInDiscord

Product

PricingRewardsPartnersAll Tools

Resources

CoinsGuidesWikiNews

Company

AboutContactSupportLegal

Data provided by

CoinGecko

© 2026 BlockViz.xyz
All rights reserved.

Home
›News

Latest News

Home
›News
›Bitcoin Excels in Geopolitical Stress Test as Stocks Decline
Bitcoin Excels in Geopolitical Stress Test as Stocks Decline

Bitcoin Excels in Geopolitical Stress Test as Stocks Decline

March 13, 2026|By BlockViz Insights
BTC

Bitcoin is acing the geopolitical stress test while stocks bleed out. Amid US-Israel strikes on Iran wiping $3 trillion from global equities in days, BTC climbed from $66k to $70.5k this week. S&P down 3% month-to-date, Dow shedding points on oil spikes to $85, a classic risk-off panic.

Why the divergence? Bitcoin's shedding its "risk asset" label, acting more like digital gold in this mess. Geopolitical hedges kicked in: BTC up 6% during peak tensions, outpacing gold's measly 1%. Nations and whales are stacking sats as fiat corridors clog and sanctions bite. Crypto flows where capital needs to.

This matters now because it proves BTC's maturation. Equities tied to corporate earnings and energy costs are crumbling; Bitcoin thrives on pure scarcity amid chaos.

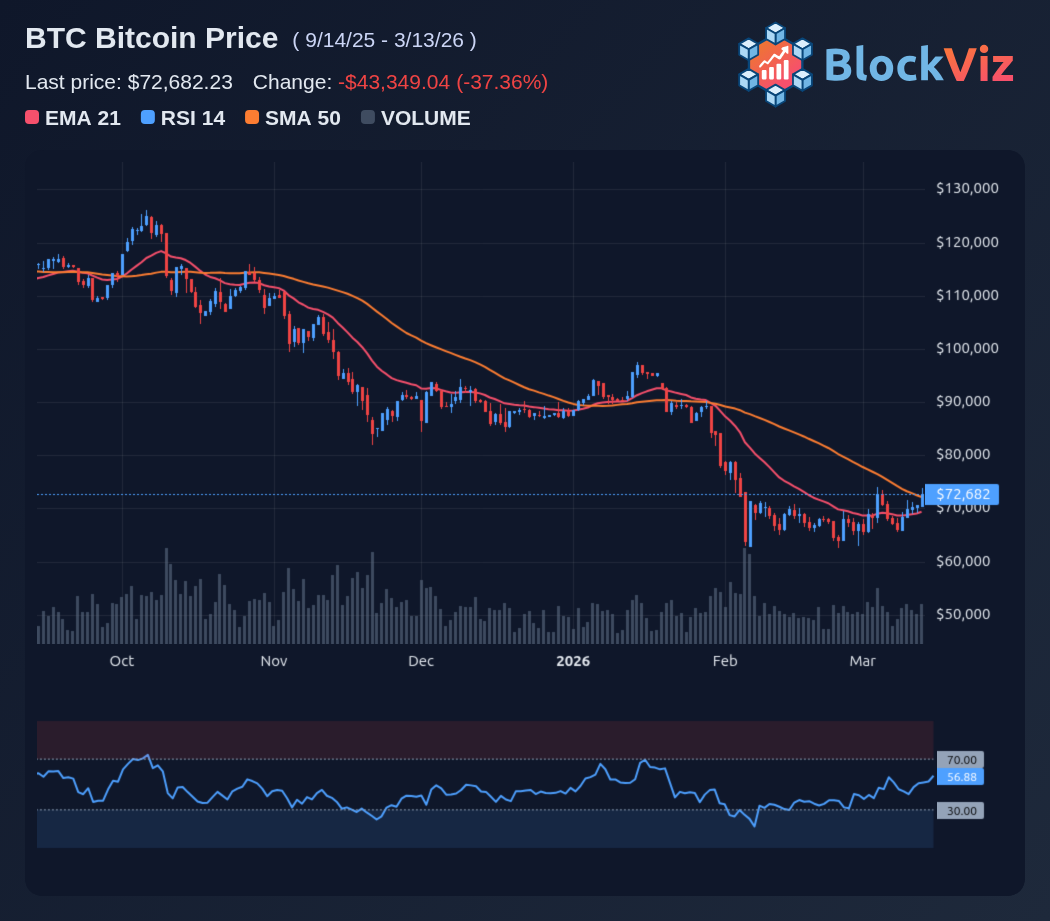
Key levels to watch include $72k for resistance and $68k for support. Market flows, particularly those influenced by geopolitical developments, will continue to shape Bitcoin's price trajectory.

Technical Analysis Chart preview

Explore this related tool

Technical Analysis Chart

Use the interactive tool to explore the same concept with your own time range and settings.

Related Tool
Technical Analysis Chart

Technical Analysis Chart

Open Tool →

More News
XRP Wallet Growth Hits Record as Price Clears $1.60 Resistance

XRP Wallet Growth Hits Record as Price Clears $1.60 Resistance

Mar 17, 2026
Bitcoin’s Eight-Day Rally Signals Thin Supply and Macro Relief

Bitcoin’s Eight-Day Rally Signals Thin Supply and Macro Relief

Mar 16, 2026
BlackRock's Staked ETH ETF Launches: Can ETHB Drive ETH Past BTC?

BlackRock's Staked ETH ETF Launches: Can ETHB Drive ETH Past BTC?

Mar 12, 2026
Whale Deploys $194M in BTC and ETH Bets: $75K Breakout Incoming?

Whale Deploys $194M in BTC and ETH Bets: $75K Breakout Incoming?

Mar 10, 2026