With January 2026 in the books, let's look back at the brutal reality check nobody wanted.
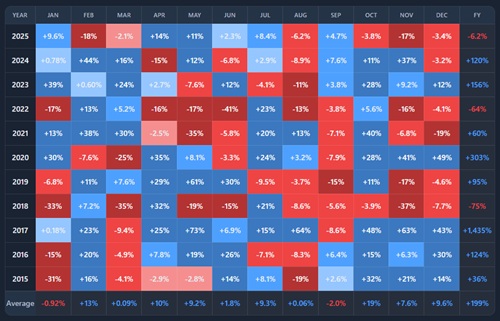
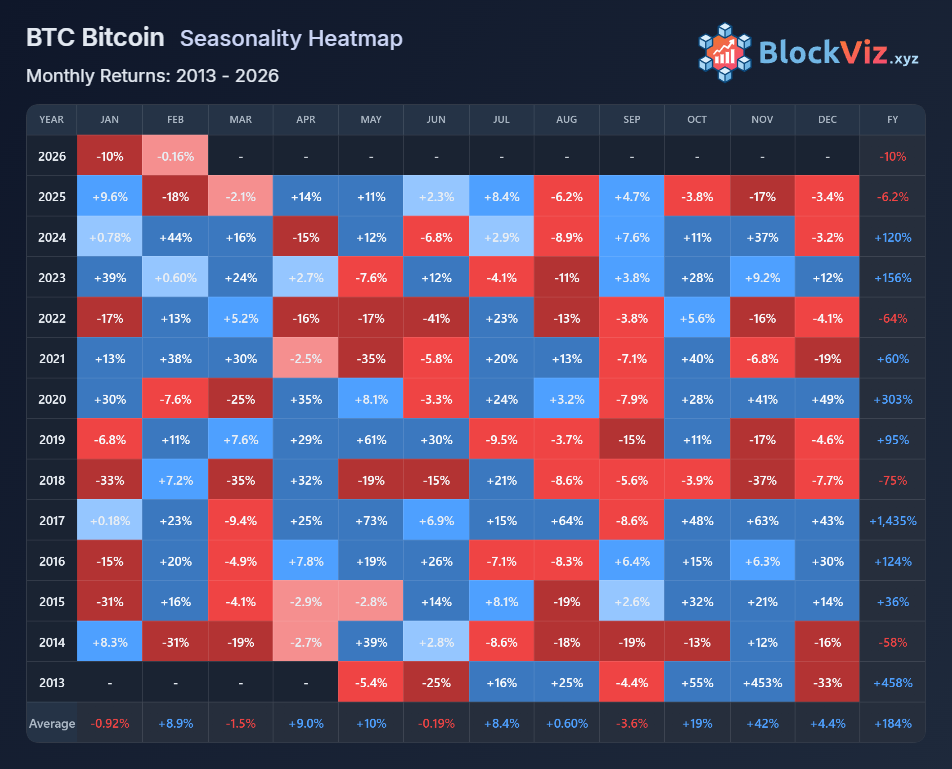
Bitcoin closed January 2026 down -10%. That is way below the average January (-0.9%), and it sits with the uglier Januaries (2015, 2016, 2018, 2022). Not quite “2018 bad,” but still one of the weaker starts in the sample.
And it was not random calendar magic. January 2026 had actual, heavy drivers.
What made Jan 2026 a red month
1) Liquidity scare, with a very specific catalyst
Late month, risk assets got hit when Kevin Warsh was picked to lead the Federal Reserve. He had already talked about shrinking the Fed balance sheet, and the market read that as “less liquidity,” which is basically kryptonite for anything that trades like a leveraged liquidity beta.
2) A violent “real safe haven” bid into metals, especially silver
While BTC was sliding, precious metals went vertical. Spot silver pushed into triple digits and was still up roughly 60%+ on the month, driven by momentum buying and speculative flows.
There was also a China angle: silver was running on concerns that new Chinese export licensing rules could tighten supply, on top of the broader speculative bid into “real assets.”
If you were wondering why BTC did not catch a “flight-to-safety” bid, that month answered it. In January 2026 the market chose metal, not the “digital” version.
3) Geopolitics was not background noise, it was the tape
Oil and macro were trading headlines: Venezuela, Iran, and the Black Sea all featured in a messy stretch, including drones hitting oil tankers in the Black Sea and rising Iran-related risk.
On top of that, Trump’s tariff and foreign-policy posture was being blamed for pushing investors toward gold and silver.
4) Leverage finally snapped
Once BTC lost key levels, it turned into a derivatives flush: around $1.7B of liquidations in 24 hours, hundreds of thousands of traders, overwhelmingly longs.
You could see the risk appetite drain even before the wipeout: billions left top stablecoins over roughly 10 days, which is basically people cashing out instead of recycling into stables to buy dips.
The cycle point
Look across the heatmap and January behaves like a mood ring. In “good regime” years (2020, 2023) January screams green. In “hangover” years (2015, 2018, 2022, and now 2026) it starts red and stays heavy.
January 2026 was a clean combo: liquidity fears + geopolitical risk + a historic metals squeeze + leverage getting rinsed. The -10% fits the cycle more than the calendar.